
📑 Table of Contents
1. What Is the Guppy Multiple Moving Average (GMMA)?
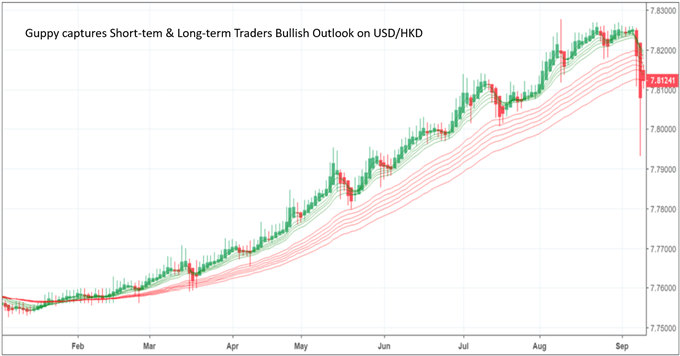
The Guppy Multiple Moving Average (GMMA) is a powerful technical indicator developed by Daryl Guppy, an Australian trader and author, in his book Trading Tactics. Unlike traditional moving average systems, the GMMA uses 12 exponential moving averages (EMAs) divided into two distinct groups, each representing different market participants.
The GMMA is designed to reveal the interaction between short‑term traders and long‑term investors, providing unique insights into market sentiment, trend strength, and potential turning points. It is not a simple crossover indicator — instead, it visually displays the relationship between speculative money and committed capital.
2. Understanding the GMMA Structure
The GMMA consists of two groups of six EMAs each, carefully chosen to capture the behaviour of different market participants.
Short‑Term Group — Trader Sentiment
This group uses periods: 3, 5, 8, 10, 12, and 15. It represents the activity of short‑term traders — speculative, reactive money that moves quickly in response to market sentiment and news. When these EMAs are rising and well‑separated, it indicates strong trader confidence and momentum.
Long‑Term Group — Investor Sentiment
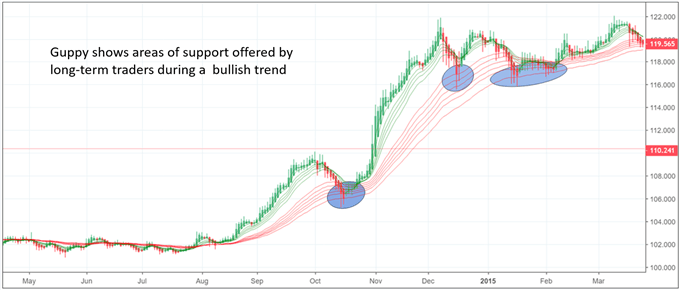
This group uses periods: 30, 35, 40, 45, 50, and 60. It represents the activity of long‑term investors — committed capital that is less reactive and provides the underlying trend foundation. When these EMAs are rising, it confirms a sustainable trend that is supported by institutional and long‑term money.
The 12 EMA Settings Explained
| Group | EMA Periods | Purpose | Represents |
|---|---|---|---|
| Short‑Term (Traders) | 3, 5, 8, 10, 12, 15 | Identify short‑term momentum | Trader sentiment and activity |
| Long‑Term (Investors) | 30, 35, 40, 45, 50, 60 | Identify long‑term trend | Investor sentiment and conviction |
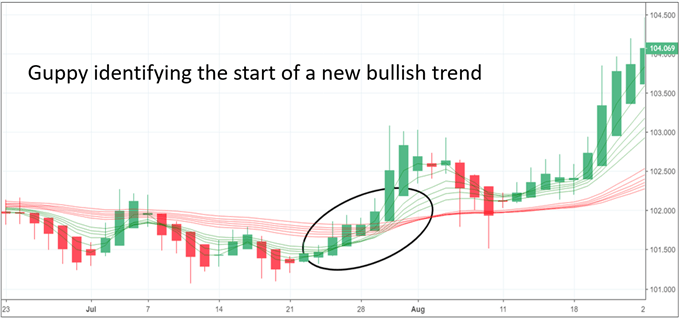
📌 The short‑term group provides early warnings of trend changes, while the long‑term group confirms the sustainability of the trend.
3. How to Read the GMMA Indicator
The true power of the GMMA lies in interpreting the relationship between the two groups — not just the direction of individual lines. The following signals are the most important:
Uptrend vs Downtrend Identification
- Strong Uptrend: Short‑term group is above the long‑term group, with wide separation. Both groups are rising. This indicates strong bullish momentum supported by both traders and investors.
- Strong Downtrend: Short‑term group is below the long‑term group, with wide separation. Both groups are falling. This indicates strong bearish momentum.
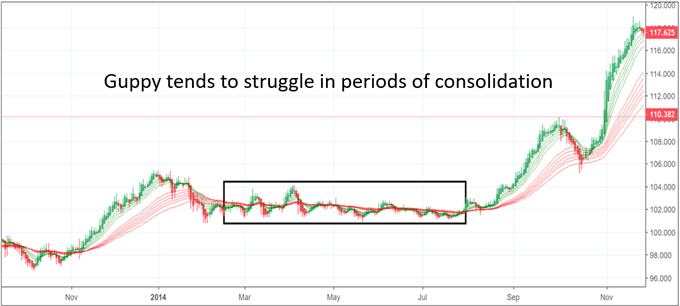
- Weak Trend: Groups are close together or overlapping. This indicates market indecision or consolidation.
Compression — Market Agreement
Compression occurs when the short‑term and long‑term groups converge and become tightly packed. This signals that traders and investors are agreeing on price and value. Historically, compression is often followed by a significant breakout in either direction, making it a powerful preparatory signal.
Expansion — Trend Strength
Expansion occurs when the groups diverge. Wide separation indicates strong conviction and a well‑established trend. Narrow separation suggests weak trend or lack of conviction.
Separation — Momentum Analysis
The distance between the two groups is a direct measure of trend momentum. Increasing separation signals strengthening momentum; decreasing separation signals weakening momentum and potential trend reversal.
4. GMMA Trading Strategies
Several proven strategies have been developed around the GMMA. The key is to combine the indicator’s signals with proper risk management.
Trend Following Strategy
This is the most straightforward application. Enter in the direction of the trend when the short‑term group is clearly separated from the long‑term group, and both are moving in the same direction. Entry: On a pullback to the short‑term group or when the group re‑expands after compression. Stop‑Loss: Below the long‑term group (for longs) or above it (for shorts).
Breakout Confirmation Strategy
Use compression followed by expansion as a confirmation signal. When price breaks out of a range and the GMMA groups are compressed (indicating agreement), the breakout is more likely to be genuine. Entry: On the breakout with volume confirmation. Stop‑Loss: Just beyond the breakout level.
Compression‑Breakout Strategy
This strategy specifically targets periods of compression. When the groups converge, prepare for a breakout. Entry: Enter in the direction of the breakout when price moves decisively away from the compression zone. Stop‑Loss: On the opposite side of the compression zone.
Combining GMMA with Other Indicators
GMMA works well with other indicators:
- GMMA + RSI: Use RSI to confirm overbought/oversold conditions at GMMA signals.
- GMMA + MACD: Use MACD to confirm momentum and divergence.
- GMMA + Support/Resistance: Combine with key horizontal levels for confluence.
5. GMMA Settings and Customisation
While the default settings work well for swing and position trading, you can adjust the periods to suit your trading style and timeframe.
| Trading Style | Short Periods | Long Periods | Best Timeframe | Key Focus |
|---|---|---|---|---|
| Scalping | 2, 4, 6, 8, 10, 12 | 20, 25, 30, 35, 40, 45 | 1–5 minutes | Quick momentum changes |
| Day Trading | 3, 5, 8, 10, 12, 15 | 30, 35, 40, 45, 50, 60 | 5–15 minutes | Intraday trend strength |
| Swing Trading | 3, 5, 8, 10, 12, 15 | 30, 35, 40, 45, 50, 60 | 1–4 hours | Medium‑term trends |
| Position Trading | 5, 8, 10, 12, 15, 20 | 40, 45, 50, 55, 60, 65 | Daily | Long‑term market sentiment |
📌 Always backtest custom settings before applying them to live trading.
6. GMMA vs Other Trend Indicators
The GMMA offers unique advantages compared to other trend indicators, particularly its ability to separate trader and investor sentiment.
| Feature | GMMA | MACD | Moving Average Crossover | Ichimoku |
|---|---|---|---|---|
| Number of Lines | 12 | 2 | 2 | 5 |
| Trend Strength | Yes (separation) | Yes (histogram) | No | Yes |
| Market Sentiment | Yes (two groups) | No | No | Yes |
| Breakout Signals | Yes (compression) | No | Limited | Yes |
| Best For | Trend identification | Momentum confirmation | Simple trend following | Comprehensive analysis |
📌 The GMMA is particularly effective for visualising the interaction between different market participants, a feature not available in most other indicators.
7. Common Mistakes When Using GMMA
Even experienced traders can make mistakes when using the GMMA. Here are the most common pitfalls and how to avoid them.
- Using GMMA as a Crossover Signal: Daryl Guppy explicitly warns against this. Crossovers are not the primary signal — separation and compression are.
- Ignoring the Long‑Term Group: The short‑term group alone is unreliable. Always consider the context provided by the long‑term group.
- Overcomplicating with Too Many Settings: Stick to the default settings initially. Experiment with customisation only after mastering the basics.
- Trading Every Compression: Not all compressions lead to breakouts. Look for additional confirmation such as price breaking a trendline or support/resistance level.
- Failing to Wait for Confirmation: Entering immediately on compression without waiting for expansion or breakout can lead to false signals.
- Using GMMA in Isolation: No single indicator should be used alone. Combine GMMA with price action, volume, and other tools for better results.
8. Frequently Asked Questions
What is the Guppy Multiple Moving Average (GMMA)?
The Guppy Multiple Moving Average (GMMA) is a technical indicator developed by Australian trader Daryl Guppy. It uses 12 exponential moving averages (EMAs) split into two groups — six short‑term and six long‑term — to identify trends, market sentiment, and potential breakouts.
How does the GMMA indicator work?
The GMMA works by tracking two groups of moving averages: a short‑term group (3, 5, 8, 10, 12, 15) representing trader sentiment, and a long‑term group (30, 35, 40, 45, 50, 60) representing investor sentiment. The relationship between these groups reveals trend strength, market agreement, and potential reversals.
What do the two groups of EMAs represent?
The short‑term group represents trader sentiment and short‑term momentum. The long‑term group represents investor sentiment and the underlying trend. When both groups agree on direction, the trend is strong.
What does compression mean in GMMA?
Compression occurs when the short‑term and long‑term groups converge, indicating that traders and investors agree on price and value. This often precedes a significant breakout in either direction.
What does expansion mean in GMMA?
Expansion occurs when the short‑term and long‑term groups diverge, indicating disagreement about price and value. Large separation between groups signals a strong trend; narrow separation signals a weak trend or consolidation.
Is GMMA a crossover indicator?
No. While crossovers between the two groups can signal trend reversals, Daryl Guppy explicitly warns against using the GMMA as a simple moving average crossover tool. The true value lies in the separation and compression between the groups.
What are the default GMMA settings?
The default GMMA settings are: Short‑term group — 3, 5, 8, 10, 12, 15; Long‑term group — 30, 35, 40, 45, 50, 60. These settings work well on daily charts for swing and position trading.
How do you trade with GMMA?
Common GMMA strategies include: trend following (enter when short group is above long group with separation), breakout confirmation (wait for compression followed by expansion), and reversal trading (cross above/below signals).
What is the best timeframe for GMMA?
The GMMA works on all timeframes, but it is most effective on higher timeframes (4‑hour, daily, weekly) where trends are clearer. Lower timeframes produce more signals but with lower reliability.
What is the difference between GMMA and MACD?
GMMA uses 12 EMAs split into two groups to show trend strength and market sentiment, while MACD uses two lines and a histogram for momentum. GMMA provides more visual information about trader vs investor behaviour.
🧠 Master Trading Psychology: Combine your GMMA trend analysis with a strong psychological foundation. Read our comprehensive guide on FOMO in trading and how to overcome fear of missing out — understanding the emotional drivers behind trading decisions will help you stick to your GMMA‑based strategies with discipline and confidence, avoiding impulsive entries and exits that can undermine even the best indicators.
🤖 Automate Your GMMA Strategy: Ready to implement automated trend‑following strategies? Visit our Forex EA Help Center for complete guidance on installing, configuring, and optimising Expert Advisors (EAs) on MetaTrader 4/5. Learn how to program your GMMA signals into automated trading systems, understand supported strategies, payment options, installation guides, and troubleshooting tips to get your algorithmic trading up and running quickly and effectively.



 Signal2forex.com - Best Forex robots and signals


