The US dollar declined against major peers in the Asian session. This was a continuation of the weakness experienced this week. Yesterday, data from the Labor Department showed that inflation numbers for September rose at a slower rate than traders were expecting. During the month, the CPI rose at an annualized rate of 2.3%, which was lower than the expected 2.7%. The core CPI rose at an annual rate of 2.2% which was lower than the expected 2.3%. The slow growth in inflation was mostly because of energy prices. Inflation, recent market performance and pressure from President Trump could lead the Fed to reconsider its decision to continue hiking interest rates.
The price of crude oil continued the decline started on Wednesday following data from the Energy Information Administration (EIA). On Wednesday, data from the American Petroleum Institute (API) showed an inventory build-up of more than 9.75 million barrels. This was higher than the expected 2.6 million barrels. Yesterday, the EIA released inventory data that missed analysts’ forecasts. Crude oil inventories reached 5.65 million barrels, which was higher than the 2.62 million barrels that traders were expecting. Data came a few hours after OPEC lowered the demand for crude oil. In previous months, the price of crude oil has moved up as traders anticipate a reduction of demand as the US imposes sanctions on Iran.
China released its trade numbers that were better than expected. In September, exports rose by more than 14%, which was higher than the 8.9% traders were expecting. At the same time, imports rose by 14.3%, which was lower than the 15% traders were expecting. In total, the trade surplus increased to $31.6 billion. This was higher than the expected $19 billion. The country’s trade surplus with the United States widened to a record $34 billion. This number has been a focus of the Trump administration, which has imposed tariffs to limit Chinese exports to the US.
EUR/USD
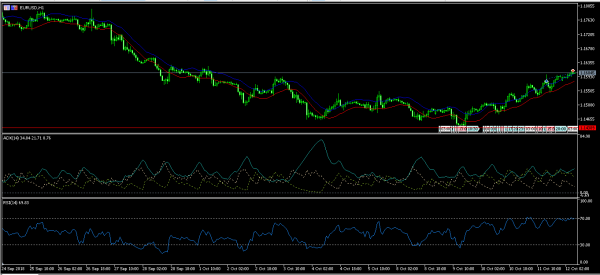
The EUR/USD pair rose to an intraday high of 1.1605 in the Asian session. This was a continuation of the rally that started this week when the pair reached a low of 1.1438. With no major economic data expected from the EU and US today, the pair will likely continue the upward movement. This is confirmed by trend indicators like ADX which is currently at 34. The RSI is currently at 69 while the MACD line shows that the pair might continue to move up.
GBP/USD
On Wednesday, the GBP/USD pair moved above the important 1.3217 level. This was the highest level since September 27. It was also the end of the cup level that the pair had been establishing. Gains by the GBP were because of the USD weakness and the hopes that a compromise will be found on Brexit negotiations. The ADX is currently at 25, an indication that the strength of the trend has eased. Similarly, the double EMA shows that the gap between the two has narrowed. Therefore, while the pair could continue moving up, traders should be cautious because it might also move lower to complete the cup and handle pattern.
XTI/USD
Last week, the price of Brent reached a record high of $76.76 as traders placed their hopes on Iran sanctions. This week, the price declined sharply and today, it reached a low of $70.35. This was after the increase in inventories. Today’s low was along the 50% Fibonacci Retracement level. It was also along the important psychological level of $70. The price is currently along the lower band of the Bollinger Bands and is likely to continue to move lower.
 Signal2forex.com - Best Forex robots and signals


