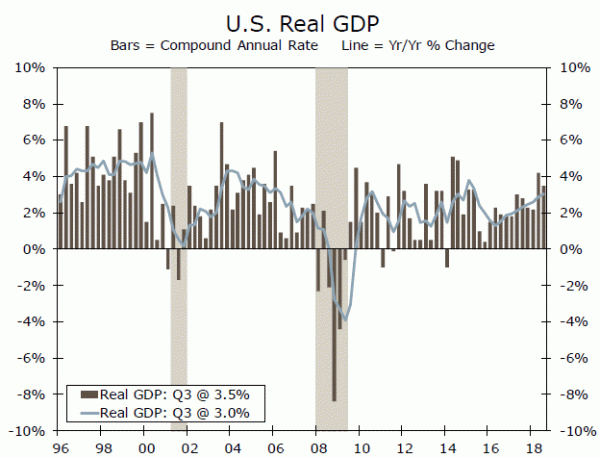
The U.S. economy continues to grow at a strong rate, which likely will induce the Federal Reserve to continue raising rates at a gradual pace.
Strong Growth in Consumer and Government Spending
U.S. real GDP grew at an annualized rate of 3.5% in Q3-2018 on a sequential basis (top chart). The outturn, which was a bit stronger than the consensus forecast, represents a modest downshift from the 4.2% rate that was notched up in Q2. The overall rate of real GDP growth in the third quarter was driven in part by robust growth in real personal consumption expenditures (PCE), which surged 4.0%. The strength in real PCE in Q2 (3.8%) and Q3 likely reflects, at least in part, the boost to real disposable income that was delivered by reductions in personal income tax rates earlier this year.
The effects of expansionary fiscal policy also showed up in government spending, which shot up 3.3% in the third quarter, the strongest sequential rate of growth in more than two years. Another boost to real GDP growth in the third quarter came from stock-building. Inventories dropped $37 billion in the second quarter, so businesses ramped up production in Q3 to rebuild depleted stocks. The $76 billion rise in inventories in Q3 added 2 percentage points to the overall GDP growth rate (middle chart). (if you want to make money in financial markets, use our forex auto trading robot)
Drags from Fixed Investment and Net Exports
But not everything was positive in the GDP accounts. Specifically, overall fixed investment spending contracted 0.3%. Although real spending on intellectual property grew 7.9% and spending on equipment edged up 0.4%, growth in these investment components was not strong enough to offset the 7.9% drop in non-residential construction and the 4.0% decline in residential construction. In that regard, many recent indicators point to leveling off, if not some outright contraction, in the housing market. It appears that affordability issues and higher mortgage rates may be exerting some drag on the housing market.
Net exports, which shaved off 1.8 percentage points from the topline GDP growth rate in the third quarter, was another area of weakness (bottom chart). The seesaw pattern of export growth recently—exports jumped 9.3% in Q2 but contracted 3.5% in Q3—reflects the effects of tariffs. Specifically, exports of soybeans surged in Q2 as farmers shipped their crops ahead of the implementation of foreign tariffs, but soybean exports have pulled back more recently, at least through the first two months of Q3.
NOTE: if you do not have time to search for strategies and study all the tools of the trade, you do not have the extra funds for testing and errors, tired of taking risks and incurring losses – trade with the help of our best forex robots developed by our professionals. You can free download forex robot based on stop and reverse system for testing results in Metatrader.
Which Way Forward?
Growth downshifted a bit in Q3 and we look for some further slowing in the quarters ahead. That said, the U.S. economy continues to grow in excess of the rate that most analysts consider to be its long-run potential growth rate. Consequently, the unemployment rate, which has dropped to its lowest level (3.7%) in nearly 50 years, likely will recede further in coming months. With the labor market more or less at “full employment” and with some measures of inflation trending higher, we look for the Federal Reserve to continue raising rates at a gradual pace for the next year or so.


 Signal2forex.com - Best Forex robots and signals


