We estimate that the actual unemployment rate is still within our estimated range of the natural unemployment rate. The Fed will probably continue to tighten, although it can do so at a gradual pace.
The Natural Unemployment Rate Continues to Move Lower
In a recent report that is intended for technically inclined readers, we presented a methodology to estimate the natural rate of unemployment, which analysts refer to as the non-accelerating inflation rate of unemployment (NAIRU) or u* (u-star). This non-technical report discusses some implications of that previous report.
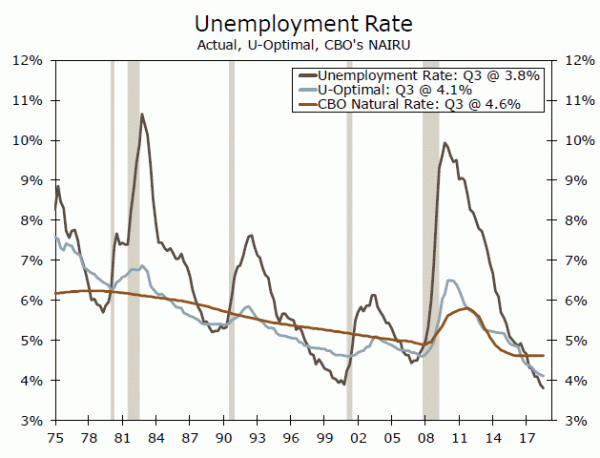
Our estimate of the natural unemployment rate, which we call “u-optimal,” is shown in the top chart. We find that u-optimal has generally trended lower over the past forty years, although it does tend to edge higher when the economy enters recession. We estimate that u-optimal currently stands at 4.1%, which is a bit above the 3.8% unemployment rate averaged during Q3-2018. But our estimate of the natural unemployment rate is below the 4.6% estimate of the Congressional Budget Office (CBO).
We would caution readers against putting undue weight on a precise estimate of the natural rate of unemployment because it is not directly observable and must be estimated from other economic variables. Rather, one should think about the natural rate in terms of a range. In that regard, we estimate that the natural rate of unemployment is currently in a range of 3.6% to 4.6% (middle chart).
Although a discussion of an unobservable natural rate of unemployment may seem a bit academic, there are some implications that stem from the estimated range of this rate. First, because the actual unemployment rate (3.7%) is still within our estimated range, the Fed likely can continue to raise rates at a gradual pace (i.e., 25 bps at every other FOMC meeting). If the actual unemployment rate were below the bottom end of our range, then the Fed may find it necessary to undertake a more aggressive pace of rate hikes. But because the actual unemployment rate is near the bottom of our estimated range, the Fed probably has a few more rate hikes to go. Why?
In the bottom chart we plot the year-over-year change in average hourly earnings (AHE), which is a measure of wage inflation, versus the difference between u-optimal and the actual unemployment rate, which measures slack in the labor market. A rise in the actual unemployment rate relative to u-optimal (i.e., an increase in labor market slack) has historically been associated with a drop in wage inflation. Conversely, a reduction in labor market slack (a narrowing in the gap between u-optimal and the actual unemployment rate) has historically been associated with rising wage inflation.
The gap between u-optimal and the actual unemployment rate has narrowed significantly in recent years. Although wage growth has trended higher in recent years, it is still well short of rates that prevailed at this point in previous cycles. Therefore, there is the risk that limited slack in the labor market could lead to further wage acceleration going forward, which could cause inflation rates to move markedly above the Fed’s target of 2%.
 Signal2forex.com - Best Forex robots and signals


