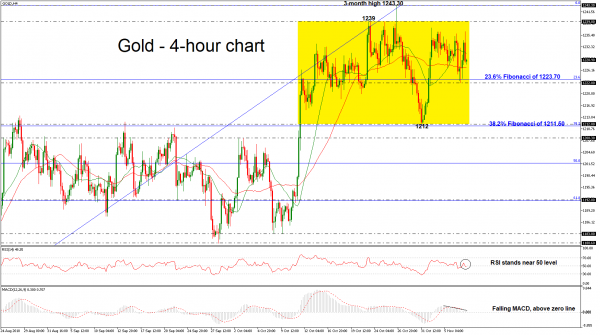
Gold is currently trading within a consolidation area over the last month, with upper boundary the 1239 resistance level and lower boundary the 1212 support barrier. At the end of the previous month, the price reached a new three-month peak of 1243.30, endorsing the scenario for bullish tendency, however, it returned back to neutral mode.
In the short-term chart, the RSI indicator is sloping down and is ready to enter into the negative territory, while the MACD oscillator dropped below the trigger line and is hovering slightly above the zero line.
A fall below the 40-simple moving average (SMA) would probably stop around the 23.6% Fibonacci retracement level of the upleg from 1160 to 1243.30, around 1223.70, which stands near the 1222.80 support. The next level is coming from the 38.2% Fibonacci mark, which hovers around the 1212 key level.
On the other side, a move higher and above today’s peak of 1236.38 would likely retest the upper boundary of the trading range at 1239. Should bulls overcome that region, the focus would probably turn to three-month high of 1243.30.
Overall, the yellow metal looks neutral as it develops in a sideways channel in the near-term, while in the bigger picture remains in a bullish retracement following the rebound at 1160.
NOTE: if you do not have time to search for strategies and study all the tools of the trade, you do not have the extra funds for testing and errors, tired of taking risks and incurring losses – trade with the help of our best forex robots developed by our professionals. You can free download forex robot based on stop and reverse system for testing results in Metatrader.
 Signal2forex.com - Best Forex robots and signals


