Most traders will agree that there are few things more enjoyable than riding a steady uptrend all the way to the top. Unfortunately, as the old adage goes, “all good things must come to an end”. This is particularly true in trading which is why it is essential to understand when a move to the downside is likely to emerge and how to manage your risk accordingly. In this article, we will share with you what the hanging man candlestick reversal pattern is and how to trade it.
What is the Hanging Man?
A hanging man candle (aptly named) is a candlestick formation that reveals a sharp increase in selling pressure at the height of an existing uptrend. This is generally brought about by many market participants believing the market has reached its highest level resulting in the ‘bears’ outweighing the ‘bulls’. This can be observed in the GBPUSD chart below where it is clear to see the red candle appearing at the top of the upward trend as a result of mass selling pressure.
GBP/USD HANGING MAN CANDLESTICK

NOTE: if you do not have time to search for strategies and study all the tools of the trade, you do not have the extra funds for testing and errors, tired of taking risks and incurring losses – trade with the help of our best forex robots developed by our professionals.
Characteristics of the Hanging Man candle
The hanging man candle is characterized by having a small real body, little or no upper shadow (wick) and a lower shadow at least twice the length of the body.
- Upward trend: The hanging man can only be identified as such once it has formed at the top of an uptrend.
- Opening level: The hanging man candle can either be a green candle (bullish), or a red candle (bearish) although, the bearish candle provides a better indication of a weakening market.
- Upper shadow: A small upper shadow indicates that there was an attempt to maintain the current uptrend before the significant drop in the price of the Pound Sterling.
- Long lower shadow: This is probably one of the most insightful observations on the candle, depicting a significant sell off before the bulls tried to regains some ground forcing the closing price to end up somewhat closer to opening levels but still down for the period.
- Closing level: In this case the closing level was below the opening level and therefore, confirms that this is a bearish hanging man candle.
Identifying hanging man candlestick trading signals
The hanging man candlestick can be used to identify a short trade (bearish view of the market) as the long shadow indicates massive selling. The true test of the legitimacy of the hanging man candlestick is often revealed in subsequent activity on the chart. If the following candle moves further down and breaks below the short term upward trend line, this can be seen as a continuation of the downward long term trend. Another possible entry level could be to enter the trade once the market has moved past the low of the hanging man candle.
Trading the Hanging Man?
It is important to view the hanging man candle formation in relation to the long term trend. The best way to do this is to make use of multiple time frame analysis. Start off by viewing the market using a longer time frame chart like the daily or weekly time frame to observe the direction the market is tending to in the long term. Then, zoom-in using a smaller time frame chart (4 hour or 2 hour) to analyze the ideal entry point for your trade.
Step 1: Identify the long term trend
View the chart on a longer time frame (perhaps a daily chart) to get an idea of the direction the market is heading. You do not want to place a trade in the opposite direction of the long term trend.
Step 2: Spotting your ideal entry point
Making use of a shorter time frame chart (4 hour chart), identify the ideal entry point. The hanging man candle formation provides us with a signal for a short trade.
Step 3: Make use of supporting indicators
Does the RSI confirm that the market has turned and now in a downward trend? Has the 20 SMA line crossed over the 50 SMA line? Does the hanging mancandlestick appear near the top of the short term uptrend? Is a relevant Fibonacci retracement level nearby?
Step 4: Place your trade
Look for an entry point at the low of the hanging man candlestick. If your bearish view of the market is correct, you will see subsequent price action moving down – providing you with an indication to place your short trade.
Step 5: Risk management
Be sure to place your trade in accordance with your position sizing strategy. Consider how much of your total account value you are prepared to risk at any point in time and do not deviate from this. At DailyFX, we talk about risking less than 5% on all open trades. In addition, ensure that you place your stop at the high of the hanging man candle formation.
Step 6: When to close out of the trade?
Whenever entering a trade it is always best to have at least a 1:2 Risk-to-Reward ratio. You are risking half of what you intend to gain. This means that the distance from your entry level to your take profit level should be twice the distance from your entry level to your stop loss level. Applying this simple technique will mean that even if you only get half of your trades correct, you will still have a positive trading account. We talk about these trading insights in our Traits of Successful Traders research.
GBP/USD DAILY PRICE CHART (DOWNTREND)
Zooming in a little further making use of the shorter, 4 hour chart (below), you will be better equipped to spot the ideal opportunity to enter the trade.
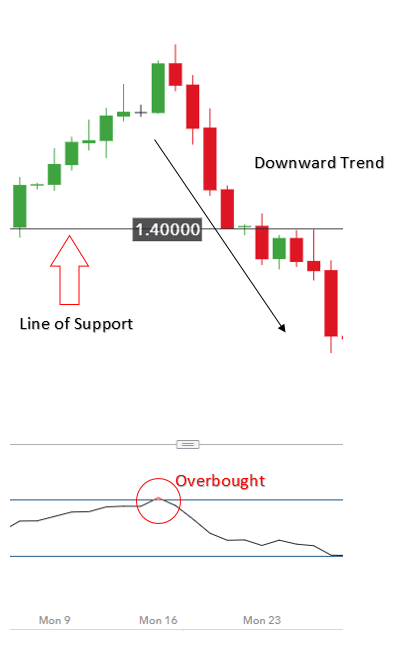
GBP/USD (4 HOUR)HANGING MAN CANDLE

On the 4 hour chart you will see that the previous level of support 1.40000, now acting as a level of resistance. The hanging man candle appears near the peak of the short term uptrend, below the new level of resistance. At this point, we are on the lookout for a reversing market to the downside. Eventually, price breaks below the low of the hanging man delivering an entry signal to short. Stops can be placed at the level of resistance (1.40000) for risk management purposes should the market move against you.
Confirmation of the sell signal:
- Long term downward trending market
- Hanging man candle appearing near the peak of the short term uptrend
- Hanging man appearing near a significant level of support/resistance
- Subsequent candles moving lower (lower highs & lower lows)
Frequently Asked Questions (FAQs)
What markets am I likely to find the hanging man formation?
The hanging man can appear in all markets however, due to the depth and volume in forex you will find the hanging man appearing frequently in forex. Forex is one of the most liquid markets in the world with an average daily trading volume in excess of $5 trillion making it attractive to a lot of traders. If you are unsure of what forex is or how to read a quote read our New to Forex Guide.
How do I identify effective levels of support and resistance?
Levels of support and resistance provide an indication of the range in which prices tend to trade. These are significant price levels that have been approached in the past but have not been broken; or have been broken momentarily before reversing direction. It is important to know where these levels are and how to accurately identify them.
What are other tricks to strengthen the signal from a hanging man candlestick pattern?
Look for other indicators to turn lower and produce sell signals once the hanging man pattern forms. If you are unsure of which indicator to use, we suggest “4 Effective Indicators Every Trader Should Know”
We offer you free download forex robot based on stop and reverse system for testing results in Metatrader.
 Signal2forex.com - Best Forex robots and signals


