
📑 Table of Contents
- 1. What Are Forex Candlesticks?
- 2. Why Candlestick Charts Are Essential
- 3. How to Read a Candlestick Chart
- 4. Single-Candle Patterns
- 5. Two-Candle Patterns
- 6. Three-Candle Patterns
- 7. Bullish vs Bearish Patterns
- 8. Pattern Reliability & Success Rates
- 9. How to Trade Candlestick Patterns
- 10. Candlestick Pattern Psychology
- 11. Common Mistakes
- 12. Frequently Asked Questions
1. What Are Forex Candlesticks?
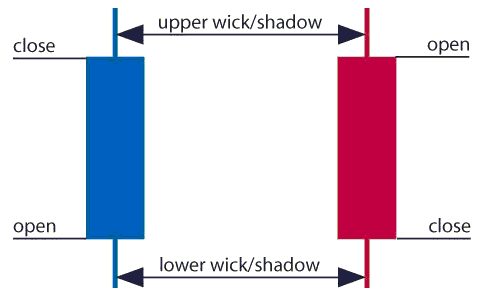
A candlestick is a visual representation of price movement over a specific time period. Each candlestick shows four key price points: the Open, High, Low, and Close (OHLC). The body of the candle represents the range between the open and close, while the wicks (or shadows) show the high and low.
Candlestick charts originated in Japan over 300 years ago, developed by rice trader Munehisa Homma. Today, they are the most widely used chart type in forex trading because they provide a clear, visual representation of market psychology and price action at a glance.
Key components of a candlestick:
- Body — the filled or hollow rectangle showing the open-close range
- Upper wick (shadow) — the line from the body high to the session high
- Lower wick (shadow) — the line from the body low to the session low
- Bullish candle — close is higher than open (typically green or white)
- Bearish candle — close is lower than open (typically red or black)
2. Why Candlestick Charts Are Essential for Forex Traders
Candlestick charts offer several advantages over other chart types like line charts or bar charts:
- Visual clarity — patterns are easy to spot at a glance
- Market psychology — each candle reflects the battle between buyers and sellers
- Reversal signals — many patterns provide early warnings of trend changes
- Continuation signals — patterns can confirm that a trend is likely to continue
- Universal applicability — candlesticks work on all timeframes and all markets
However, candlestick charts also have limitations. They do not provide a complete picture on their own — they should be used in conjunction with other forms of analysis like support/resistance, trendlines, and volume. Additionally, patterns are most reliable on higher timeframes (daily, 4‑hour) and less reliable on lower timeframes (1‑minute, 5‑minute).

3. How to Read a Candlestick Chart
Reading a candlestick chart is straightforward once you understand the basic structure. Here is a step‑by‑step guide:
- Identify the time frame — each candle represents a specific period (1 minute, 1 hour, 1 day, etc.)
- Check the body — a long body indicates strong buying or selling pressure; a short body indicates indecision
- Examine the wicks — long wicks indicate rejection of price levels; short wicks indicate strong momentum
- Look for patterns — combinations of candles form recognizable patterns that signal reversals or continuations
- Consider the context — a pattern is only valid if it appears in the right location (e.g., a hammer at the bottom of a downtrend)
Pro Tip: The most powerful signals occur when candlestick patterns align with key support/resistance levels, Fibonacci retracements, or other technical indicators.
4. Single-Candle Patterns
Single‑candle patterns are the building blocks of candlestick analysis. They provide quick, actionable signals that can be spotted in seconds.
| Pattern | Type | Signal | Appearance | Best Use |
|---|---|---|---|---|
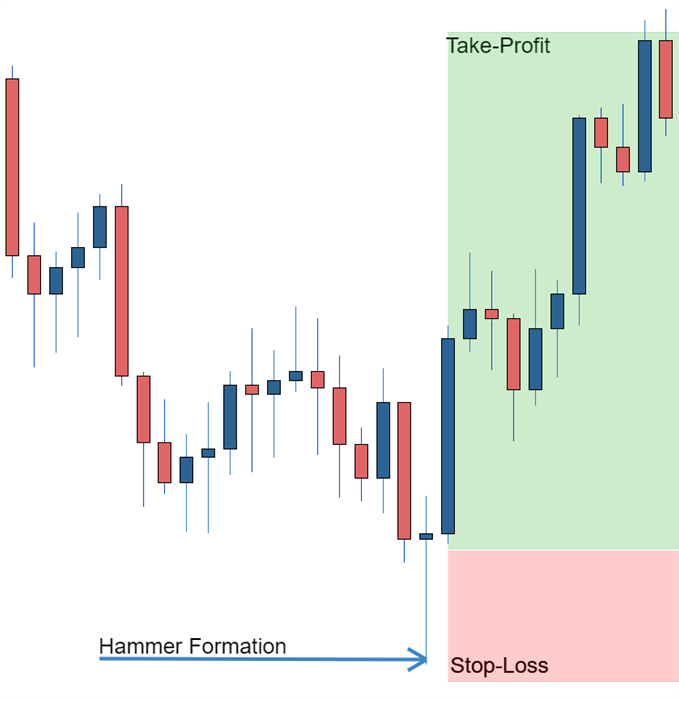
| Hammer | Bullish Reversal | Buy | Small body, long lower wick (2x body) | Bottom of downtrend |
| Inverted Hammer | Bullish Reversal | Buy | Small body, long upper wick (2x body) | Bottom of downtrend |
| Hanging Man | Bearish Reversal | Sell | Small body, long lower wick (2x body) | Top of uptrend |
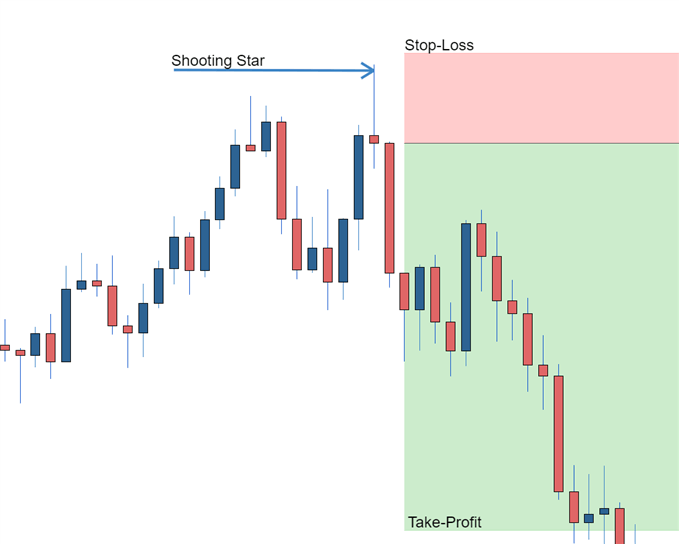
| Shooting Star | Bearish Reversal | Sell | Small body, long upper wick (2x body) | Top of uptrend |
| Doji | Indecision | Neutral | Open = Close, small wicks | Anywhere (warning of potential reversal) |
📌 Single‑candle patterns are most reliable when they appear at key support or resistance levels. Always wait for confirmation before entering a trade.
5. Two-Candle Patterns
Two‑candle patterns provide stronger signals than single‑candle patterns because they show a shift in momentum over two consecutive periods.
| Pattern | Type | Signal | Description | Reliability |
|---|---|---|---|---|
| Bullish Engulfing | Bullish Reversal | Buy | Large green candle fully covers previous red | High |
| Bearish Engulfing | Bearish Reversal | Sell | Large red candle fully covers previous green | Very High |
| Tweezer Bottom | Bullish Reversal | Buy | Two candles with the same low | Medium |
| Tweezer Top | Bearish Reversal | Sell | Two candles with the same high | Medium |
📌 Engulfing patterns are among the most reliable candlestick signals. The larger the engulfing candle, the stronger the signal.
6. Three-Candle Patterns
Three‑candle patterns are considered the most reliable because they show a complete shift in market sentiment over three periods.
| Pattern | Type | Signal | Description | Reliability |
|---|---|---|---|---|
| Morning Star | Bullish Reversal | Buy | Bearish candle → Doji → Bullish candle | Very High |
| Evening Star | Bearish Reversal | Sell | Bullish candle → Doji → Bearish candle | Very High |
| Three White Soldiers | Bullish Continuation | Buy | Three consecutive large green candles | High |
| Three Black Crows | Bearish Continuation | Sell | Three consecutive large red candles | High |
📌 The Morning Star and Evening Star patterns are among the most reliable reversal signals in technical analysis, especially on daily and weekly charts.
7. Bullish vs Bearish Candlestick Patterns
Candlestick patterns can be broadly categorised into bullish (buy) signals and bearish (sell) signals. Understanding the difference is essential for effective trading.
Bullish patterns suggest that buying pressure is increasing and prices are likely to rise. They typically appear at the bottom of downtrends or during pullbacks within uptrends. Common bullish patterns include the Hammer, Inverted Hammer, Bullish Engulfing, Morning Star, and Three White Soldiers.
Bearish patterns suggest that selling pressure is increasing and prices are likely to fall. They typically appear at the top of uptrends or during rallies within downtrends. Common bearish patterns include the Hanging Man, Shooting Star, Bearish Engulfing, Evening Star, and Three Black Crows.
Key distinction: Bullish patterns signal that buyers are gaining control; bearish patterns signal that sellers are gaining control. The context in which the pattern appears is critical — a hammer in an uptrend is not a valid signal, while a hammer in a downtrend is a strong buy signal.
8. Pattern Reliability and Success Rates
Not all candlestick patterns are equally reliable. Research and backtesting have shown that certain patterns consistently outperform others.
| Pattern | Win Rate (1 Day) | Win Rate (17 Days) | Best Context |
|---|---|---|---|
| Bearish Engulfing | ~55% | ~70% | Top of uptrend |
| Bullish Engulfing | ~53% | ~68% | Bottom of downtrend |
| Morning Star | ~52% | ~65% | Bottom of downtrend |
| Hammer | ~50% | ~62% | Key support levels |
| Shooting Star | ~48% | ~60% | Key resistance levels |
📌 Data based on historical backtesting across multiple currency pairs. Win rates improve significantly when patterns are combined with other forms of analysis.
9. How to Trade Candlestick Patterns
Trading candlestick patterns requires more than just recognising the pattern. A structured approach to entry, stop‑loss placement, and profit targets is essential.
Entry Strategies
- Conservative entry — wait for a close above the pattern’s high (bullish) or below the pattern’s low (bearish) with volume confirmation
- Aggressive entry — enter on a retest of the pattern’s key level (e.g., the hammer’s high or the engulfing candle’s close)
- Breakout entry — enter when price breaks the neckline or confirmation level
Stop-Loss Placement
- Standard placement — place your stop‑loss below the low of the pattern (bullish) or above the high of the pattern (bearish)
- Tight stop — place your stop‑loss below/above the confirmation candle
- Wide stop — place your stop‑loss below/above recent support/resistance levels
Profit Targets
- First target — previous swing high or low
- Second target — Fibonacci extension or measured move
- Third target — major support/resistance level
Confirmation Techniques
- Volume — a breakout should be accompanied by a surge in volume
- Support/Resistance — patterns are stronger when they form at key levels
- Indicators — RSI divergence, MACD crossovers, or moving average alignment
- Trendlines — a break of a trendline adds confirmation to the pattern signal
10. Candlestick Pattern Psychology
Understanding the psychology behind candlestick patterns is the key to trading them successfully. Each pattern reflects the battle between buyers and sellers and the emotions driving the market.
| Pattern | Market Psychology | What Traders Are Feeling |
|---|---|---|
| Hammer | Selling pressure rejected | “I was wrong to sell — buyers are stepping in” |
| Shooting Star | Buying pressure rejected | “I was wrong to buy — sellers are taking control” |
| Engulfing | Complete momentum shift | “The balance of power has completely changed” |
| Doji | Indecision and exhaustion | “Neither side can win — a reversal may be coming” |
📌 The most powerful signals occur when the psychology behind the pattern aligns with broader market sentiment and key technical levels.
11. Common Mistakes When Trading Candlestick Patterns
Even experienced traders make mistakes with candlestick patterns. Avoid these common pitfalls:
- Ignoring the trend context — a pattern is only valid in the right location; a hammer in an uptrend is meaningless
- Not waiting for confirmation — entering immediately on the pattern without waiting for the next candle is a common beginner mistake
- Trading every pattern — not every pattern is a valid signal; focus on those that appear at key levels
- Forcing patterns — trying to fit price action into a pattern when it does not clearly exist
- Ignoring volume — volume confirmation is essential for a valid breakout
- Using patterns on very low timeframes — patterns are most reliable on daily, 4‑hour, and 1‑hour charts
- Setting tight stop‑losses — patterns often retest levels before moving in the expected direction
12. Frequently Asked Questions
What are forex candlestick patterns?
Forex candlestick patterns are visual formations on price charts that represent the open, high, low, and close of a trading period. They help traders identify potential reversals, continuations, and market sentiment.
How do you read a candlestick chart?
Each candlestick shows four price points: open, high, low, and close (OHLC). A green/white candle means the close was higher than the open (bullish), while a red/black candle means the close was lower than the open (bearish). The wicks show the high and low prices.
What are the most reliable candlestick patterns?
According to recent research, Bearish Engulfing has the highest reliability, with a win rate of approximately 55% after one day and over 70% by day 17. Bullish Engulfing, Morning Star, and Hammer are also considered highly reliable.
What is the difference between a hammer and a hanging man?
Both have a small body and a long lower wick. The difference is context: a hammer appears at the bottom of a downtrend (bullish reversal), while a hanging man appears at the top of an uptrend (bearish reversal).
What is a bullish engulfing pattern?
A bullish engulfing is a two‑candle pattern where a large green candle completely covers the body of the previous red candle. It signals a strong shift in momentum from sellers to buyers and typically appears at the bottom of a downtrend.
What is a doji candlestick?
A doji forms when the open and close prices are virtually equal, creating a cross‑like appearance. It signals indecision in the market and often precedes a reversal or significant price move.
What is the most profitable candlestick pattern?
While no pattern works every time, Bearish Engulfing has been shown to be the most reliable in backtests. However, profitability depends on proper context, confirmation, and risk management.
How many candlestick patterns are there?
There are dozens of candlestick patterns. The most important ones include single‑candle patterns (Hammer, Shooting Star, Doji), two‑candle patterns (Engulfing, Harami), and three‑candle patterns (Morning Star, Evening Star).
Do candlestick patterns work in forex?
Yes, candlestick patterns work effectively in forex trading. They are widely used by forex traders to identify key turning points and market sentiment. However, they work best when combined with other forms of analysis like support/resistance and trendlines.
What is the best time frame for candlestick patterns?
Candlestick patterns work on all time frames. Daily and 4‑hour charts are generally considered more reliable for swing trading, while lower time frames (15‑min, 1‑hour) are used for day trading. Higher timeframes produce fewer signals but greater significance.
📈 Build Consistent Profits: Master the art of trading without chasing perfection with our guide on How to Trade Consistently Without Having the Perfect Strategy — essential reading for traders at any level who want to develop a reliable, repeatable approach.
📊 Combine Candlesticks with Chart Patterns: Learn to identify high‑probability setups with our comprehensive guide on the Falling Wedge Pattern — a powerful bullish reversal signal that works exceptionally well when combined with candlestick confirmation.



 Signal2forex.com - Best Forex robots and signals


