
📑 Table of Contents
1. What Is a Falling Wedge Pattern?
A falling wedge is a bullish chart pattern that forms when price consolidates between two downward‑sloping, converging trendlines. It signals that selling pressure is weakening and a potential breakout to the upside may be imminent. The pattern is considered one of the most reliable reversal and continuation signals in technical analysis.
The falling wedge gets its name from its visual appearance — the price action narrows into a wedge shape that points downward. Despite the downward slope, the pattern is typically bullish, with the breakout occurring to the upside. In approximately 63% of cases, the pattern’s target is reached once resistance is broken, making it a relatively reliable chart pattern.

2. How to Identify a Falling Wedge Pattern
Identifying a valid falling wedge requires a systematic approach. Look for these key characteristics:
- Lower highs and lower lows — price makes progressively lower swing highs and lower swing lows
- Converging trendlines — both support and resistance lines slope downward and converge
- Declining volume — volume typically decreases as the pattern develops
- At least five touches — minimum two touches on one trendline and three on the other
- Breakout — price breaks above the upper trendline (resistance) to confirm the pattern
Step‑by‑Step Identification Rules
- Confirm the trend context — identify whether the pattern appears within an uptrend (continuation) or at the bottom of a downtrend (reversal)
- Draw the trendlines — connect the lower highs with a descending resistance line and the lower lows with a descending support line
- Check convergence — verify that the two trendlines are converging toward each other
- Monitor volume — volume should decline during the formation and spike on the breakout
- Wait for confirmation — a close above the upper trendline with a volume surge confirms the pattern
Common Mistakes in Identification
- Confusing with a descending triangle — a descending triangle has a flat bottom, while a falling wedge has a sloping bottom
- Forcing the pattern — not every consolidation is a wedge; wait for clear converging trendlines
- Ignoring volume — volume confirmation is essential for a valid breakout
- Trading the breakout without confirmation — false breakouts are common; always wait for a close above resistance
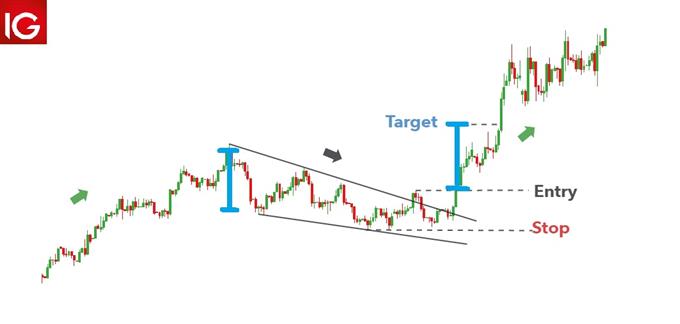
3. Falling Wedge: Continuation vs Reversal Pattern
The falling wedge can function as either a continuation or a reversal pattern, depending on where it appears within the broader trend.
Falling Wedge as a Continuation Pattern
When a falling wedge forms within an existing uptrend, it represents a temporary consolidation or pullback before the trend resumes. In this context, the wedge is a bullish continuation pattern — price breaks to the upside and continues the prevailing upward trend. This is the most common interpretation of the pattern.
Falling Wedge as a Reversal Pattern
When a falling wedge forms at the bottom of a downtrend, it can signal a bullish reversal. The pattern shows that selling momentum is fading as buyers gradually step in, eventually leading to a breakout above resistance. This reversal scenario is often accompanied by a surge in volume on the breakout.
How to Distinguish Between Them
The key difference lies in the trend context. If the wedge appears after a significant uptrend, it is likely a continuation pattern. If it appears after a prolonged downtrend, it is likely a reversal pattern. The breakout direction (typically upside) is the same in both cases, but the implications for your overall trading strategy differ.
4. How to Trade the Falling Wedge Pattern
Trading the falling wedge requires a structured approach to entry, stop‑loss placement, and profit targets. Below is a comprehensive strategy.
Entry Strategies
- Conservative entry — buy on the close above the upper trendline with a volume surge. This is the safest approach for beginners.
- Aggressive entry — buy on a throwback retest of the broken resistance level. This offers a better risk‑reward ratio but requires patience.
- Anticipatory entry — buy near the lower trendline within the pattern. This is for advanced traders comfortable with higher risk.
Stop‑Loss Placement
- Standard placement — place your stop‑loss below the lowest point of the wedge (the most recent swing low).
- Tight stop — place your stop‑loss below the breakout candle’s low. This is a tighter stop but may be triggered by normal market noise.
- Wide stop — place your stop‑loss below the entire wedge formation. This gives the trade more room but reduces the risk‑reward ratio.
Profit Targets (Measured Move Technique)
The measured move technique is the most common method for setting profit targets. Measure the height of the wedge at its widest point (from the highest point of the upper trendline to the lowest point of the lower trendline). Project this distance upward from the breakout point to estimate the first profit target. A second target can be set at 1.5x or 2x the measured move.
Volume Confirmation
Volume is a critical component of a valid falling wedge. During the formation, volume should decline as the wedge narrows. On the breakout, volume should spike to confirm that buyers are stepping in with conviction. A breakout on low volume is suspect and may result in a fakeout.
5. Falling Wedge vs Rising Wedge Pattern
The falling wedge and rising wedge are mirror images of each other. The table below compares their key characteristics to help you distinguish between them.
| Feature | Falling Wedge | Rising Wedge |
|---|---|---|
| Direction | Downward‑sloping | Upward‑sloping |
| Trendlines | Both slope down, converge | Both slope up, converge |
| Market Sentiment | Bullish (breakout to upside) | Bearish (breakout to downside) |
| Pattern Type | Continuation or Reversal | Continuation or Reversal |
| Location | Bottom of downtrend or within uptrend | Top of uptrend or within downtrend |
| Volume | Declines during formation, spikes on breakout | Declines during formation, spikes on breakdown |
| Breakout Direction | Typically to the upside | Typically to the downside |
| Reliability | High (63% reach target) | Medium‑High |
📌 The falling wedge is bullish (breakout to the upside), while the rising wedge is bearish (breakout to the downside). Always confirm the breakout direction with volume.
6. Best Timeframes for Falling Wedge Patterns
The reliability of a falling wedge pattern varies significantly depending on the timeframe you are trading. Higher timeframes produce fewer signals but carry greater significance.
| Timeframe | Reliability | Best Use | Signal Frequency |
|---|---|---|---|
| 1‑Minute | Low | Not recommended | Very High |
| 5‑Minute | Low‑Medium | Scalping | High |
| 15‑Minute | Medium | Day trading | Medium‑High |
| 1‑Hour | Medium‑High | Swing trading | Medium |
| 4‑Hour | High | Swing trading | Low‑Medium |
| Daily | Very High | Position trading | Low |
| Weekly | Very High | Long‑term analysis | Very Low |
📌 For swing trading, the 4‑hour and daily timeframes offer the best balance between reliability and signal frequency. Avoid lower timeframes unless you are a professional scalper.
7. Real‑World Example: Trading the Falling Wedge
Let’s walk through a real‑world example of trading the falling wedge pattern on the Gold (XAU/USD) daily chart.
Scenario: Gold has been in an uptrend, rising from $1,900 to $2,050. After reaching $2,050, price enters a consolidation phase, forming lower highs and lower lows over several weeks. Two downward‑sloping trendlines converge, creating a falling wedge pattern.
Trade Setup:
- Entry: Buy on a close above the upper trendline (resistance) with a volume spike.
- Stop‑Loss: Place the stop‑loss 10 pips below the lowest point of the wedge.
- Target 1: The measured move — measure the height of the wedge and project it upward from the breakout point.
- Target 2: The previous swing high at $2,050.
Outcome: Gold breaks above the upper trendline with strong volume and rallies to $2,050 within two weeks, hitting both targets. The trade delivers a risk‑reward ratio of approximately 1:2.5.
This example illustrates the power of the falling wedge pattern when combined with proper confirmation and risk management.
8. Frequently Asked Questions
What is a falling wedge pattern?
A falling wedge is a bullish chart pattern formed when price bounces between two downward‑sloping, converging trendlines. It signals that selling pressure is weakening and a potential bullish breakout may occur. In approximately 63% of cases, the pattern reaches its measured move target.
Is a falling wedge a continuation or reversal pattern?
A falling wedge can be both. It is a continuation pattern when it appears within an uptrend (consolidation before continuing higher) and a reversal pattern when it appears at the bottom of a downtrend (signalling a trend change to the upside).
How do you identify a falling wedge pattern?
Look for two downward‑sloping trendlines that converge, with price making lower highs and lower lows. The pattern should have at least five touches total (two on one side, three on the other). Volume typically declines during formation and spikes on the breakout.
What is the difference between a falling wedge and a rising wedge?
A falling wedge slopes downward and is typically bullish (breakout to the upside), while a rising wedge slopes upward and is typically bearish (breakout to the downside). The falling wedge signals buyer accumulation, while the rising wedge signals seller distribution.
How do you trade a falling wedge pattern?
Conservative traders enter on a close above the upper trendline. Aggressive traders enter on a throwback retest after the breakout. Place stop‑loss below the lowest point of the wedge. Set profit targets using the measured move technique.
What is the measured move technique for falling wedge?
Measure the height of the wedge at its widest point (from the highest point of the upper trendline to the lowest point of the lower trendline). Project this distance upward from the breakout point to estimate the profit target.
Do you need volume confirmation for a falling wedge?
Yes. A valid breakout should be accompanied by a surge in volume to confirm the move. Volume typically declines during the formation of the wedge and spikes on the breakout. A breakout on low volume is suspect and may result in a fakeout.
What is a fake breakout (fakeout) in a falling wedge?
A fake breakout occurs when price breaks above the upper trendline but then reverses and falls back into the wedge. This underscores the importance of placing stop‑losses with sufficient breathing room and waiting for a close above resistance with volume confirmation.
What is the success rate of the falling wedge pattern?
In approximately 63% of cases, the pattern’s target is reached once resistance is broken, making it a relatively reliable chart pattern.
What are the best timeframes for falling wedge patterns?
Daily and weekly charts are generally considered more reliable than lower intraday timeframes. For swing trading, the 4‑hour and daily timeframes offer the best balance between reliability and signal frequency.
📊 Stay Ahead of the Markets: Visit our Market Overviews for daily analysis of major currency pairs, commodities, and indices — including real‑time insights on volatility and key technical levels to complement your wedge pattern trading.
📈 Master Breakout Trading: Explore our comprehensive guide on Breakout and Pullback Trading Strategies — the perfect complement to your wedge pattern analysis, covering entry timing, false breakout identification, and trade management techniques.



 Signal2forex.com - Best Forex robots and signals


