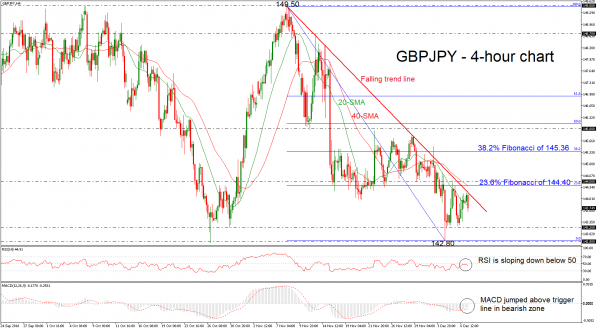
GBPJPY has declined considerably after touching a two-month high of 149.50 at the beginning of November. In the short-term the price seems to be negative, while in the daily chart the pair remains in a sideways channel over the last three months with upper boundary the 149.50 resistance and lower boundary the 142.80 support.
Technically, the RSI indicator is pointing south near the 50 level, while the MACD oscillator is moving above the trigger line and is approaching the zero line.
Immediate support is coming from the 143.20 price level, which it reached on October 30, while even lower the market could challenge the six-week low of 142.80. Marginally below the latter level, the price could open the door for the 142.60 barrier, registered on September 4.
If there is a successful attempt higher and a jump above the short-term falling trend line, GBPJPY could hit the 23.6% Fibonacci retracement level of the downleg from 149.50 to 142.80, around 144.40, and the 145.50 resistance barrier. Also, the price could find resistance around the 40-simple moving average (SMA) which stands near the aforementioned levels. A successful jump above these lines would push the market until the 38.2% Fibonacci of 145.36.
Overall, the neutral picture in the medium term looks to last for a while longer after prices failed to create a rally to exit from the range. In the short-term, the pair has been trading below the descending trend line.


 Signal2forex.com - Best Forex robots and signals


