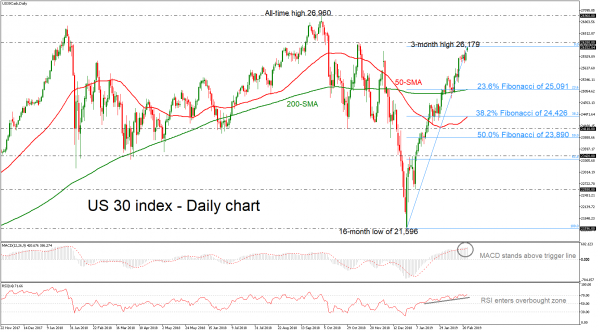
The US 30 index has been in a flying mode, recording a new three-month high of 26,179 after the rebound on the 16-month low of 21,596 on December 26, successfully surpassing the 50- and 200-simple moving averages (SMAs) in the daily timeframe. This implies that the short-term picture remains positive, albeit cautiously so, with a break above the all-time high of 26,951 needed to confirm that the bulls are in full control.
However, the technical indicators are holding in overbought zones, suggesting that a pullback may be on the cards. The RSI jumped above the 70 level and the MACD stands above its trigger line with weaker momentum than before.
In case of a correction lower, preliminary support may be found near the crossroads of the 200-day SMA at the 23.6% Fibonacci retracement level of 26,179 around 25,091. A clear break below this area would turn the bias back to neutral in the short-term and could set the stage for a rest around the 38.2% Fibonacci of 24,426, which hovers near the 50-day SMA.
On the other hand, if the bulls continue to have the control, immediate resistance could come around 26,280, which capped the rally on November 8. If buyers pierce above that, the next obstacle may be the all-time high of 26,960.
In the short-term bias, the indicators point for a possible bearish retracement, however, the index is still creating higher highs and higher lows over the last couple of months.
For traders: our Portfolio of forex robots for automated trading has low risk and stable profit. You can try to test results of our forex ea download
Signal2forex reviews


 Signal2forex.com - Best Forex robots and signals


