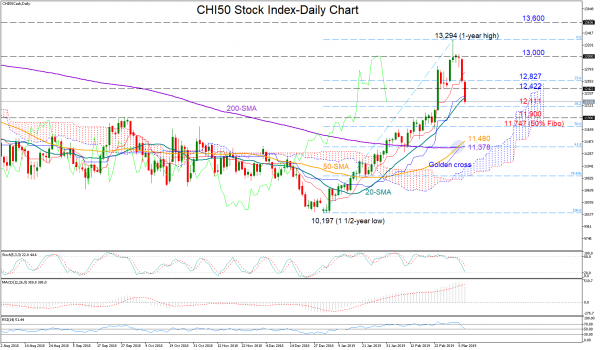
China 50 stock index plunged by more than 6% in the latest two trading sessions after topping at a one-year high of 13,294 on March 4, recording its biggest daily losses since late October.
The RSI has left its overbought zone above 70 and returned to 50, while the MACD slipped below its red signal line, confirming the recent bearish correction. In Ichimoku indicators, though, the red Tenkan-sen line predicts a more positive short-term picture as the index maintains a steep positive slope above the blue Kijun-sen. Meanwhile, according to the Stochastics, which are moving faster towards the 20 oversold mark now, the sell-off may not last for long.
The 38.2% Fibonacci of 12,111 of the upleg from 10,197 to 13,294 is in breathing distance below the price action and therefore could act as an immediate support if negative momentum strengthens even further. Under that level, the bears may rest within the 11,900-11,747 territory before a crucial battle potentially inside the 11,480-11,378 area, encapsulated by the 50- and the 200-day simple moving averages.
In case of a rebound, nearby resistance could appear between 12,422 and the 23.6% Fibonacci of 12,827. Higher, a break above 13,000 may trigger a more aggressive rally towards the 13,294 top. Any significant violation at this point would bring the bullish mode back into play, confirming the sustainability of the January uptrend as well. Higher the next stop could be near 13,600, taken from from the highs on March 18.
Summing up, chances for improvement in the short term have not faded yet, while in the medium-term CHI50 index continues to hold a positive, with the golden cross between the 50- and the 200-day MA increasing hopes for a stronger bull market.


 Signal2forex.com - Best Forex robots and signals


