
📑 Table of Contents
- 1. What Is Fundamental Analysis in Forex?
- 2. What Is Technical Analysis in Forex?
- 3. Fundamental vs Technical Analysis — Key Differences
- 4. Why Combine Fundamental and Technical Analysis?
- 5. How to Combine Fundamental and Technical Analysis — 4 Proven Strategies
- 6. Step-by-Step Hybrid Trading Framework
- 7. Fundamental and Technical Analysis — Detailed Comparison
- 8. Real Trading Examples (2024–2026)
- 9. Common Mistakes When Combining Analyses
- 10. Frequently Asked Questions
1. What Is Fundamental Analysis in Forex?
Fundamental analysis in forex is the evaluation of economic, financial, and geopolitical factors that influence a currency’s intrinsic value. It focuses on the “what” — what should happen to a currency based on the underlying health of its economy.
Key Economic Indicators to Watch
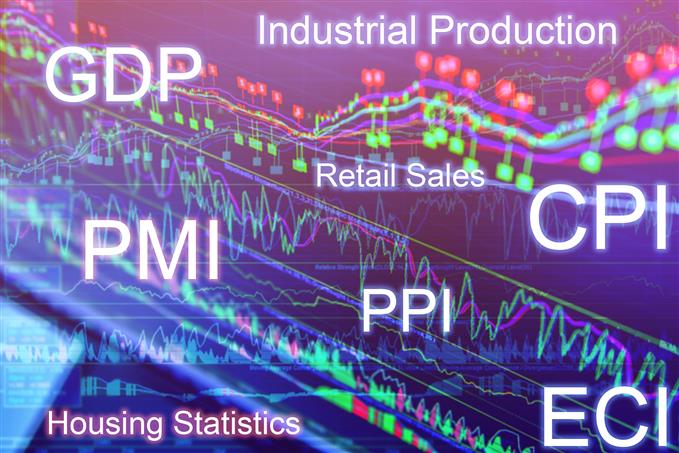
- Gross Domestic Product (GDP): Measures economic growth. Strong GDP growth typically strengthens a currency.
- Inflation (CPI, PPI): Rising inflation often leads to central bank rate hikes, which can strengthen a currency.
- Employment Data (NFP): Strong job growth signals a healthy economy and supports currency strength.
- Trade Balance: A trade surplus (exports > imports) tends to strengthen a currency.
- Retail Sales: Strong consumer spending indicates economic health and supports currency strength.
Central Bank Policy and Interest Rates
Central banks are the most powerful players in the forex market. Their policy decisions — particularly regarding interest rates — have a direct and immediate impact on currency valuations. A hawkish central bank (signalling rate hikes) typically strengthens the currency, while a dovish stance (signalling rate cuts or accommodative policy) typically weakens it.
How Fundamentals Drive Currency Valuations
Fundamentals drive currency valuations through three primary channels: interest rate differentials (higher rates attract foreign capital), economic growth prospects (stronger growth attracts investment), and political stability (stable countries attract safe-haven flows).
2. What Is Technical Analysis in Forex?
Technical analysis is the study of price action and market data to identify patterns and predict future price movements. It focuses on the “when” — when to enter and exit a trade based on historical price behaviour and market psychology.
Price Action and Chart Patterns
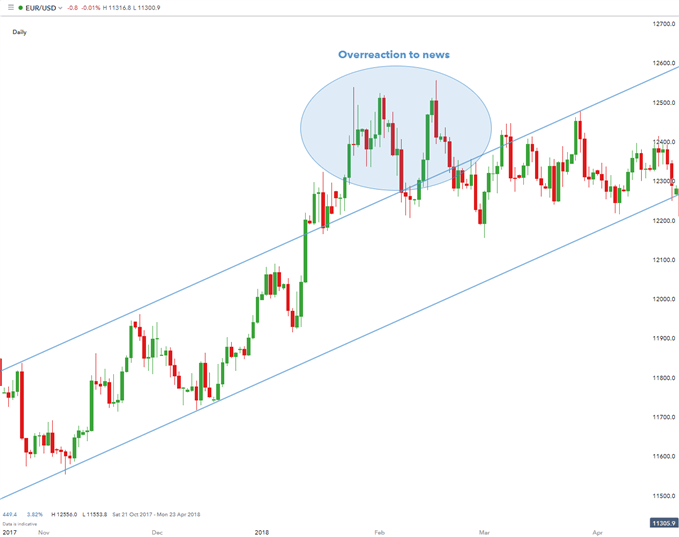
Price action is the purest form of technical analysis. It involves analysing raw price movements without the use of indicators. Key patterns include support and resistance levels, trendlines, and candlestick patterns like the engulfing candle — a two-candle reversal pattern that signals potential trend changes.
Technical Indicators — Moving Averages, RSI, MACD
Technical indicators are mathematical calculations based on price and volume. Popular indicators include:
- Moving Averages (MA): Smooth price data to identify trends. The Exponential Moving Average (EMA) gives more weight to recent prices, making it more responsive than a Simple Moving Average.
- Relative Strength Index (RSI): Measures the speed and change of price movements to identify overbought or oversold conditions.
- Moving Average Convergence Divergence (MACD): Shows the relationship between two moving averages to identify momentum and trend direction.
- Bollinger Bands: Measure volatility and identify overextended price moves.
Support, Resistance, and Trendlines
Support and resistance levels are price levels where the market has historically reversed. Support is a level where buying interest is strong enough to prevent further decline; resistance is a level where selling interest is strong enough to prevent further advance. Trendlines connect swing highs or lows to identify the direction and strength of a trend.
3. Fundamental vs Technical Analysis — Key Differences
| Aspect | Fundamental Analysis | Technical Analysis |
|---|---|---|
| Focus | Economic data, central bank policy, geopolitical events | Price action, chart patterns, indicators |
| Time Horizon | Long-term (weeks, months, years) | Short-term (minutes, hours, days) |
| Key Tools | Economic calendar, interest rates, GDP, inflation, employment data | Moving averages, RSI, MACD, support/resistance, trendlines |
| Goal | Determine fair value and direction | Determine optimal entry and exit timing |
| Best For | Position traders, investors | Day traders, swing traders, scalpers |
| Strength | Identifies “what” to trade | Identifies “when” to trade |
| Weakness | Poor timing for entries/exits | Can miss major fundamental shifts |
📌 Neither approach is inherently better — they serve different purposes. The most effective traders combine both to make more informed decisions.
4. Why Combine Fundamental and Technical Analysis?
Combining fundamental and technical analysis creates a hybrid trading approach that leverages the strengths of both methodologies while mitigating their weaknesses. Here is why this combination is so powerful.
The “What” and “When” of Trading
Fundamental analysis tells you what to trade — which currency is likely to strengthen or weaken based on economic conditions. Technical analysis tells you when to trade — the optimal entry and exit points based on price action. Together, they provide a complete trading framework.
Reducing False Signals
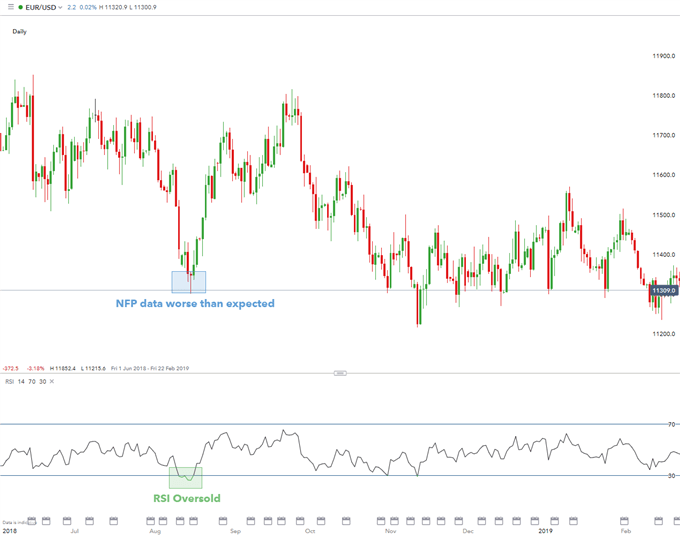
Technical signals can often be false in choppy or range-bound markets. By confirming technical signals with a fundamental bias, traders can filter out low-probability setups. For example, if RSI shows an oversold condition but the fundamental outlook for the currency is bearish, the signal is weaker and should be treated with caution.
Improving Risk-Reward Ratios
When fundamental and technical analysis align, the probability of a successful trade increases significantly. This allows traders to use tighter stop-losses (based on technical levels) while targeting larger profit zones (based on fundamental projections).
5. How to Combine Fundamental and Technical Analysis — 4 Proven Strategies
| Strategy | Fundamental Component | Technical Component | Best Market Conditions |
|---|---|---|---|
| Range-Bound | Avoid trading around high-impact news | Identify support/resistance levels | Sideways/consolidating markets |
| Breakout | News catalysts (NFP, rate decisions) | Breakout confirmation (volume, candles) | High-volatility events |
| Oscillator | Fundamental direction bias | RSI/MACD overbought/oversold signals | Trending or ranging markets |
| Trend Following | Economic strength/weakness | EMA alignment, trendline breaks | Strong directional trends |
📌 Each strategy works best in specific market conditions. The key is to match the strategy to the current market environment.
Strategy 1 — Range-Bound Trading with Fundamental Confirmation
In a range-bound market, identify clear support and resistance levels using technical analysis. Then, check the economic calendar to avoid trading around high-impact news that could trigger a breakout. This approach helps traders profit from predictable price oscillations while avoiding false breakouts driven by news events.
Strategy 2 — Breakout Trading with News Catalysts
Major economic events like NFP releases or central bank decisions often trigger significant breakouts. Traders can use fundamental analysis to anticipate the direction of the breakout and technical analysis to confirm it. For example, if strong NFP data suggests the USD will strengthen, traders can watch for a breakout above resistance on the EUR/USD chart.
Strategy 3 — Oscillator Signals with Fundamental Context
Oscillators like RSI and MACD can generate false signals in strong trends. By first establishing a fundamental bias (e.g., the US economy is strong, so the USD should appreciate), traders can use oscillator signals only in the direction of the fundamental trend. For example, in a bullish USD environment, an oversold RSI reading (below 30) is a stronger buy signal than an overbought reading.
Strategy 4 — Trend Following with Economic Backdrop
This strategy combines the EMA crossover approach with fundamental analysis. A Golden Cross (50 EMA crossing above 200 EMA) is a powerful technical signal for a bullish trend. Confirm this with a positive fundamental backdrop — strong GDP growth, rising interest rates, or hawkish central bank language — to increase the probability of success.
6. Step-by-Step Hybrid Trading Framework
| Step | Action | Tools |
|---|---|---|
| 1. Directional Bias | Determine fundamental outlook for the currency pair | Economic calendar, central bank policy, interest rate expectations |
| 2. Market Context | Identify if market is trending or ranging | Trendlines, moving averages, Bollinger Bands |
| 3. Entry Signal | Wait for technical confirmation | Breakout, RSI, MACD crossover, candlestick patterns |
| 4. Risk Management | Set stop-loss and position size | Support/resistance, ATR (Average True Range) |
| 5. Exit Strategy | Set profit target based on technicals and fundamentals | Fibonacci retracement, previous highs/lows, fundamental targets |
📌 This 5-step framework ensures that every trade is backed by both fundamental reasoning and technical confirmation, reducing emotional decision-making.
7. Fundamental and Technical Analysis — Detailed Comparison
| Aspect | Fundamental Analysis | Technical Analysis |
|---|---|---|
| Primary Focus | Economic health and valuation | Price action and market psychology |
| Data Sources | GDP, CPI, NFP, central bank statements, trade data | Price charts, volume, indicators |
| Timeframe | Weeks, months, years | Minutes, hours, days |
| Key Advantage | Provides direction and context | Provides precise entry and exit timing |
| Key Disadvantage | Poor timing — can enter too early or too late | Can miss major fundamental shifts |
| Best Used By | Position traders, long-term investors | Day traders, swing traders, scalpers |
| Key Tools | Economic calendar, interest rate forecasts, news feeds | Moving averages, RSI, MACD, support/resistance |
📌 The most successful traders use fundamental analysis to determine the “what” and technical analysis to determine the “when.”
8. Real Trading Examples (2024–2026)
Example 1 — NFP Release and RSI Divergence (2025)
In June 2025, NFP data came in significantly stronger than expected. The USD rallied sharply against most currencies. A trader using a hybrid approach would have:
- Fundamental: Expected the USD to strengthen based on the strong NFP print
- Technical: Waited for the initial spike to settle, then entered on a pullback to the 50 EMA as RSI showed oversold conditions on the pullback
- Outcome: The USD continued its rally for another 100 pips, achieving a 1:3 risk-reward ratio
Example 2 — ECB Decision and Bullish Engulfing Pattern (2024)
In July 2024, the European Central Bank surprised markets with a hawkish rate hike. The euro spiked higher immediately. A hybrid trader would have:
- Fundamental: Recognised that a hawkish ECB would support the euro
- Technical: Waited for a bullish engulfing pattern to form at a key support level on the 4-hour chart, confirming the reversal
- Outcome: The euro gained over 200 pips over the following week as the market priced in further rate hikes
Example 3 — Fed Policy Shift and EMA Crossover (2025–2026)
In late 2025, the Federal Reserve signalled a slowdown in rate hikes. A trader combining both analyses would have:
- Fundamental: Expected the USD to weaken as the Fed turned less hawkish
- Technical: Waited for the 12/26 EMA crossover to confirm the downtrend before entering a short position on USD/JPY
- Outcome: The pair dropped over 300 pips over the following months as the market priced in Fed rate cuts
9. Common Mistakes When Combining Analyses
| Mistake | Why It’s Harmful | How to Fix |
|---|---|---|
| Trading news without technical confirmation | Can get caught in whipsaw volatility | Wait for price to settle and confirm direction |
| Ignoring the bigger trend | Can trade against fundamentals on lower timeframes | Always check higher timeframe trend alignment |
| Using technicals without fundamental context | Misses major market shifts | Check economic calendar before trading |
| Overcomplicating with too many indicators | Analysis paralysis | Stick to 2–3 core indicators |
| Chasing the move after news | Buys at the top or sells at the bottom | Wait for pullback or consolidation |
📌 The key to successful hybrid trading is not overcomplicating the process — it is about using each analysis type for what it does best.
10. Frequently Asked Questions
How to combine fundamental and technical analysis in forex?
Use fundamental analysis to determine the directional bias (what to trade) and technical analysis to time your entries and exits (when to trade). For example, if economic data suggests a currency will strengthen, use technical indicators to find the best entry point.
What is the difference between fundamental and technical analysis?
Fundamental analysis evaluates economic data, central bank policy, and geopolitical events to determine a currency’s fair value. Technical analysis studies price action, chart patterns, and indicators to identify entry and exit timing.
Can you combine fundamental and technical analysis?
Yes, combining both approaches is one of the most effective trading strategies. Fundamental analysis provides the “what” (direction), while technical analysis provides the “when” (timing). Together, they create a more complete trading framework.
Which is better — fundamental or technical analysis?
Neither is inherently better — they serve different purposes. Fundamental analysis is better for long-term direction, while technical analysis is better for short-term timing. The best approach depends on your trading style and time horizon.
How do you use fundamental analysis in forex trading?
Monitor economic indicators (GDP, inflation, employment), central bank policy (interest rates, forward guidance), and geopolitical events. Use an economic calendar to track upcoming releases and their expected impact on currencies.
What are the best technical indicators to use with fundamental analysis?
Moving averages (to confirm trend direction), RSI (to identify overbought/oversold conditions), and support/resistance levels (to find entry and exit points) are among the most effective indicators to pair with fundamental analysis.
What is a hybrid trading strategy?
A hybrid trading strategy combines fundamental and technical analysis to make more informed trading decisions. It typically involves using fundamentals to establish a directional bias and technicals to time entries and exits.
How does NFP affect forex trading with technical analysis?
NFP data is a major fundamental catalyst that can trigger significant price movements. Traders often combine NFP expectations with technical indicators like RSI or support/resistance levels to identify optimal entry and exit points during the news release.
What is the role of an economic calendar in combining analyses?
An economic calendar helps traders identify upcoming fundamental events that could cause volatility. Traders can then use technical analysis to prepare for potential breakouts, reversals, or pullbacks around these events.
How to avoid false signals when combining analyses?
Use fundamental analysis to confirm the overall market direction, then wait for technical confirmation (e.g., breakout above resistance, RSI divergence) before entering a trade. This two-step process helps filter out false signals.
What is the best time frame for hybrid trading?
The 4-hour and daily timeframes are often ideal for hybrid trading because they balance the long-term fundamental view with actionable technical signals. However, the best timeframe depends on your trading style and schedule.
How do central bank decisions impact technical analysis?
Central bank decisions (rate hikes, cuts, forward guidance) can cause significant volatility. Technical analysis can help traders identify key levels to watch before and after these announcements, such as support/resistance breaks or indicator divergences.
📈 Combine Hybrid Analysis with Candlestick Confirmation: To refine your entry timing in the hybrid framework, master the Engulfing Candle Pattern — a powerful two-candle reversal signal that can confirm your fundamental bias and provide precise entry and exit points. Learn to trade bullish and bearish engulfing setups effectively.
📊 Strengthen Your Technical Analysis with EMA: Trend following is a key component of hybrid trading. The EMA Trading Strategy uses exponential moving averages to identify trend direction, momentum, and crossover signals — making it an ideal technical complement to your fundamental analysis framework.



 Signal2forex.com - Best Forex robots and signals


