
📑 Table of Contents
- 1. What Is an Engulfing Candlestick?
- 2. Bullish Engulfing Pattern
- 3. Bearish Engulfing Pattern
- 4. Engulfing Pattern vs Harami — Key Differences
- 5. How Reliable Is the Engulfing Pattern?
- 6. Engulfing Candle Trading Strategy — Step by Step
- 7. Engulfing Pattern Trading Checklist
- 8. Engulfing Pattern for Trend Continuation
- 9. Common Mistakes When Trading Engulfing Patterns
- 10. Frequently Asked Questions
1. What Is an Engulfing Candlestick?
An engulfing candle pattern is a two-candle reversal pattern where the second candle completely engulfs the body of the first candle. It signals a potential trend reversal — bullish in a downtrend or bearish in an uptrend.
There are two types of engulfing patterns: the bullish engulfing pattern, which forms at the bottom of a downtrend and signals a reversal to the upside; and the bearish engulfing pattern, which forms at the top of an uptrend and signals a reversal to the downside.
2. Bullish Engulfing Pattern
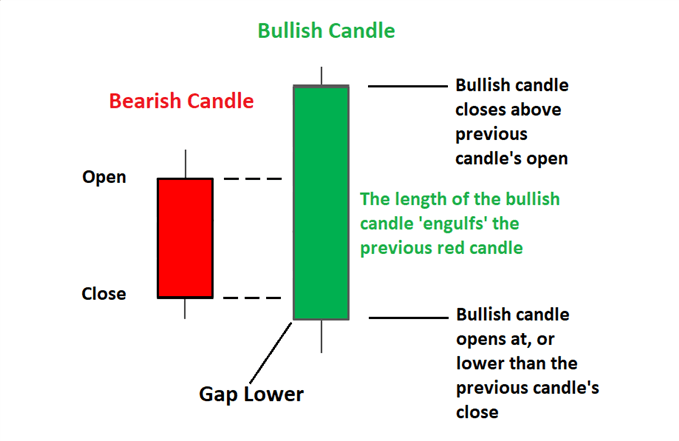
A bullish engulfing pattern forms at the bottom of a downtrend. The first candle is bearish (red), and the second candle is bullish (green) and completely engulfs the first candle’s body. This signals that buyers have taken control from sellers and a reversal to the upside may be imminent.
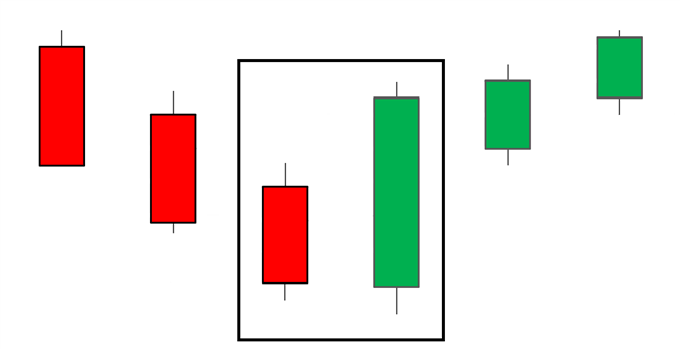
How to Identify a Bullish Engulfing
- Market Context: The pattern must form in a downtrend.
- First Candle: A bearish candle (red) with a reasonably long body.
- Second Candle: A bullish candle (green) that opens lower than the first candle’s close and closes above the first candle’s open, completely engulfing its body.
- Volume: Increasing volume on the second candle strengthens the signal.
What Does It Signal?
A bullish engulfing pattern signals that buying pressure has overwhelmed selling pressure. It suggests that the downtrend may be ending and a reversal to the upside is likely.
Bullish Engulfing Trading Example
Scenario: EUR/USD has been in a downtrend, making lower lows. A bullish engulfing pattern forms at a key support level. The first candle is bearish, closing at 1.0950. The second candle opens at 1.0940 but rallies to close at 1.1020, completely engulfing the first candle’s body.
- Entry: Buy at 1.1025 (above the high of the engulfing candle).
- Stop-Loss: Place stop-loss below the low of the engulfing candle at 1.0930.
- Take-Profit: Target the previous swing high at 1.1150.
3. Bearish Engulfing Pattern
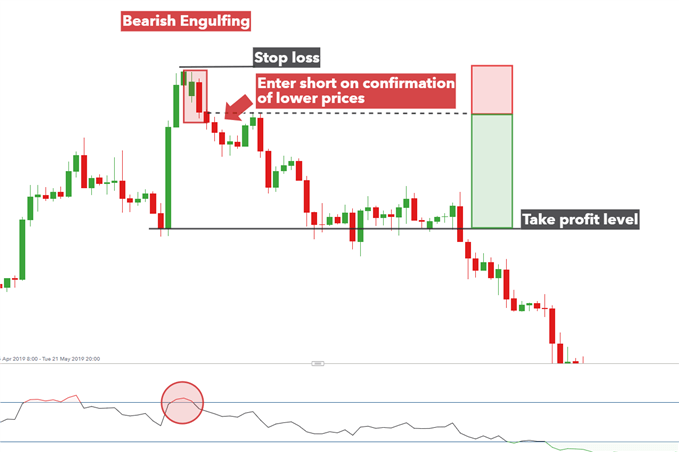
A bearish engulfing pattern forms at the top of an uptrend. The first candle is bullish (green), and the second candle is bearish (red) and completely engulfs the first candle’s body. This signals that sellers have taken control from buyers and a reversal to the downside may be imminent.
How to Identify a Bearish Engulfing
- Market Context: The pattern must form in an uptrend.
- First Candle: A bullish candle (green) with a reasonably long body.
- Second Candle: A bearish candle (red) that opens higher than the first candle’s close and closes below the first candle’s open, completely engulfing its body.
- Volume: Increasing volume on the second candle strengthens the signal.
What Does It Signal?
A bearish engulfing pattern signals that selling pressure has overwhelmed buying pressure. It suggests that the uptrend may be ending and a reversal to the downside is likely.
Bearish Engulfing Trading Example
Scenario: Gold (XAUUSD) has been in an uptrend, making higher highs. A bearish engulfing pattern forms at a key resistance level. The first candle is bullish, closing at 1.9200. The second candle opens at 1.9210 but falls to close at 1.9100, completely engulfing the first candle’s body.
- Entry: Sell at 1.9090 (below the low of the engulfing candle).
- Stop-Loss: Place stop-loss above the high of the engulfing candle at 1.9220.
- Take-Profit: Target the previous swing low at 1.8950.
4. Engulfing Pattern vs Harami — Key Differences
Understanding the differences between engulfing and harami patterns is essential for accurate identification and trading. The table below provides a clear comparison.
| Feature | Bullish Engulfing | Bearish Engulfing | Harami |
|---|---|---|---|
| Market Context | Downtrend | Uptrend | Either trend |
| First Candle | Bearish (red) | Bullish (green) | Large body |
| Second Candle Body | Engulfs first body | Engulfs first body | Contained within first body |
| Signal Strength | Strong | Strong | Moderate |
| Reversal Signal | Bullish reversal | Bearish reversal | Potential reversal |
| Reliability | ~50–70% | ~50–70% | ~45–60% |
📌 Signal Strength indicates the relative reliability of each pattern. Reliability is based on historical performance when confirmed with additional indicators.
5. How Reliable Is the Engulfing Pattern?
The reliability of the engulfing pattern depends significantly on the timeframe, market context, and confirmation signals. Here are the key statistics:
- Success Rate: Engulfing patterns typically demonstrate 50–70% accuracy depending on market conditions, timeframe, and confirmation signals.
- Daily Timeframe: Research shows the bearish engulfing pattern carries a 57% win rate on the daily timeframe.
- Support/Resistance: When engulfing patterns occur at significant support or resistance levels, reliability rates can increase to approximately 75–80% in the expected direction.
- BTC 4H: A bullish engulfing might have a 68% win rate on BTC 4H, but only 42% on EUR/USD 15m.
- Multi-Timeframe: When engulfing patterns appear on multiple timeframes simultaneously, success rates can exceed 85%.
- Volume Confirmation: Foundational patterns like engulfing produce win rates between 55% and 68%, rising to 68 to 71% when confirmed by volume.
💡 Trading tip: With proper context at significant support or resistance levels, engulfing patterns can produce reliable reversal signals in approximately 75-80% of cases. However, no pattern works 100% of the time — always use proper risk management.
6. Engulfing Candle Trading Strategy — Step by Step
Trading engulfing patterns requires a disciplined approach. Follow these five steps to maximise your chances of success.
Step 1 — Identify a Valid Engulfing Pattern
- Ensure the pattern is in the correct market context (downtrend for bullish engulfing, uptrend for bearish engulfing).
- Confirm that the second candle completely engulfs the first candle’s body.
- Check that the second candle closes decisively beyond the first candle’s open/close.
Step 2 — Wait for Confirmation
- Wait for the next candle to close in the direction of the engulfing signal.
- Look for additional confirmation from RSI, MACD, or support/resistance levels.
- A bullish engulfing followed by another green candle strengthens the signal.
Step 3 — Entry Rules
- Bullish Engulfing: Enter a long position on a break above the high of the engulfing candle.
- Bearish Engulfing: Enter a short position on a break below the low of the engulfing candle.
- Alternative Entry: Some traders enter on the retest of the engulfing candle’s extreme.
Step 4 — Stop-Loss Placement
- Bullish Engulfing: Place stop-loss below the low of the engulfing candle.
- Bearish Engulfing: Place stop-loss above the high of the engulfing candle.
- Buffer: Add a small buffer beyond the extreme to account for market noise.
- Risk Management: Never risk more than 1–2% of your trading account on a single trade.
Step 5 — Take-Profit Targets
- Bullish Engulfing: Target the previous swing high or use Fibonacci extensions (127.2%, 161.8%).
- Bearish Engulfing: Target the previous swing low or use Fibonacci extensions.
- Risk-Reward: Aim for a minimum risk-reward ratio of 1:2.
7. Engulfing Pattern Trading Checklist
Before entering a trade based on an engulfing pattern, run through this static checklist to ensure you have covered all the key criteria.
| Step | Check | Status |
|---|---|---|
| 1 | Is there a clear trend (downtrend for bullish, uptrend for bearish)? | ☑ Check |
| 2 | Is the first candle in the direction of the trend? | ☑ Check |
| 3 | Does the second candle completely engulf the first candle’s body? | ☑ Check |
| 4 | Is the second candle close strong and decisive? | ☑ Check |
| 5 | Is there confirmation from RSI, MACD, or support/resistance? | ☑ Check |
| 6 | Is the risk-reward ratio at least 1:2? | ☑ Check |
| 7 | Is the stop-loss placed beyond the engulfing candle’s extreme? | ☑ Check |
| 8 | Is the take-profit set at a logical level (swing high/low, Fibonacci)? | ☑ Check |
📌 Status indicates that each step should be verified before entering a trade. Missing any of these steps increases the risk of a losing trade.
8. Engulfing Pattern for Trend Continuation
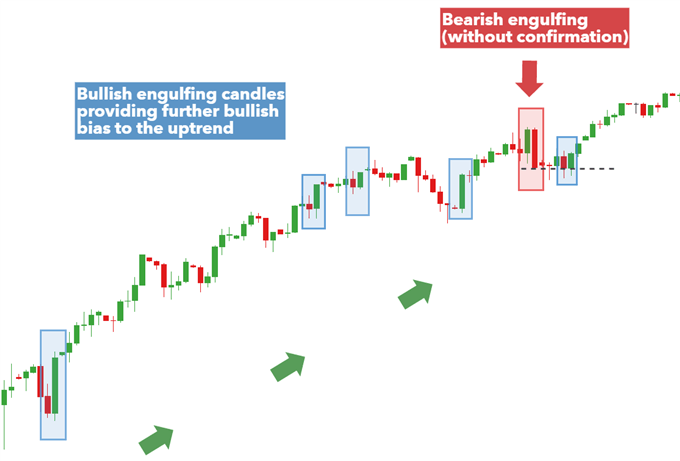
While engulfing patterns are most commonly associated with reversals, they can also signal trend continuation when they appear in the direction of an existing trend.
Bullish Engulfing in an Uptrend: When a bullish engulfing pattern forms during an uptrend, it provides additional conviction that the trend will continue. It indicates that buyers are still in control and the upward momentum remains strong.
Bearish Engulfing in a Downtrend: When a bearish engulfing pattern forms during a downtrend, it confirms that sellers are still in control and the downward momentum is likely to persist.
💡 Trading tip: Using engulfing patterns for trend continuation can be more reliable than using them for reversals, as you are trading with the prevailing trend rather than against it.
9. Common Mistakes When Trading Engulfing Patterns
Avoid these common pitfalls to improve your success rate with engulfing patterns.
- ❌ Trading the pattern in isolation: Engulfing patterns require confirmation from other indicators like RSI, MACD, or support/resistance levels.
- ❌ Ignoring the overall trend: Engulfing patterns are most reliable when they form after a prolonged trend (downtrend for bullish, uptrend for bearish).
- ❌ Entering too early: Entering before the engulfing candle closes or before a breakout can lead to false signals.
- ❌ Placing stop-loss too tight: Setting the stop-loss too close to the entry can result in being stopped out by normal market noise.
- ❌ Ignoring volume: Low volume on the engulfing candle reduces the reliability of the signal.
- ❌ Confusing engulfing with harami: An engulfing pattern has the second candle completely covering the first. A harami has the second candle contained within the first.
10. Frequently Asked Questions
What is an engulfing candle pattern?
An engulfing candle pattern is a two-candle reversal pattern where the second candle completely engulfs the body of the first candle. It signals a potential trend reversal — bullish in a downtrend or bearish in an uptrend.
What is a bullish engulfing pattern?
A bullish engulfing pattern forms at the bottom of a downtrend. The first candle is bearish (red), and the second candle is bullish (green) and completely engulfs the first candle’s body, signaling a potential reversal to the upside.
What is a bearish engulfing pattern?
A bearish engulfing pattern forms at the top of an uptrend. The first candle is bullish (green), and the second candle is bearish (red) and completely engulfs the first candle’s body, signaling a potential reversal to the downside.
How reliable is the engulfing pattern?
Engulfing patterns typically demonstrate 50-70% accuracy. With proper context at significant support or resistance levels, they can produce reliable reversal signals in approximately 75-80% of cases.
What is the difference between an engulfing pattern and a harami pattern?
In an engulfing pattern, the second candle completely covers the first candle’s body — a dramatic reversal signal. In a harami pattern, the second candle’s body is completely contained within the first candle’s body — a more subtle reversal signal.
How do you trade an engulfing pattern?
Identify the pattern, wait for confirmation (next candle in the expected direction), enter on a break above/below the engulfing candle, place stop-loss beyond the engulfing candle’s extreme, and set take-profit at a logical level (swing high/low or Fibonacci).
What confirmation signals work best with engulfing patterns?
Common confirmation signals include RSI (oversold/overbought), MACD (crossover), support/resistance levels, and subsequent price action. A bullish engulfing followed by another green candle strengthens the signal.
Can engulfing patterns be used for trend continuation?
Yes, engulfing patterns can also signal trend continuation when they appear in the direction of an existing trend. For example, a bullish engulfing during an uptrend provides more conviction that the trend will continue.
🤖 Automate your trading with precision: Download our free Scalper EURUSD M5 bot — test version for MT4. This powerful scalping robot combines 8 technical indicators with a light neural network for high-probability entries — perfect for traders who want to combine engulfing patterns with automated execution.
📈 Explore the full range of automated trading solutions: Visit our Forex robot store to discover expert advisors for every trading style — from scalping to trend following. Find the perfect EA to complement your engulfing pattern strategy and trade with confidence.
📞 Need help with your engulfing pattern trading strategy? Our team is here to assist you. Visit our Contact Page or use the online chat available on every page of our website for immediate support.



 Signal2forex.com - Best Forex robots and signals


