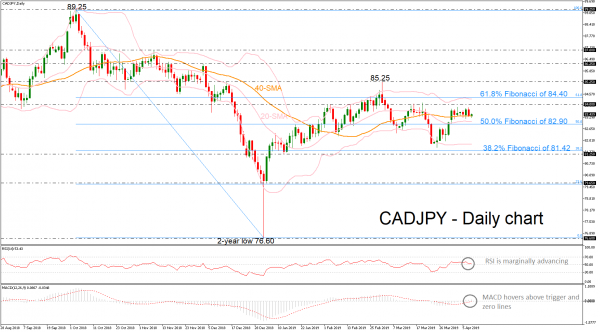
CADJPY has been finding strong support on the 40-day simple moving average (SMA) since the beginning of this month, creating a narrow sideways move.
Regarding to the momentum indicators, the RSI is flattening near the neutral threshold of 50 and the MACD is hovering above trigger and zero lines. Also, the price action holds above the mid-level of the Bollinger band, creating a trading range between the 38.2% Fibonacci of 81.42 and the 61.8% Fibonacci of 84.40 of the downleg from 89.25 to 76.60.
An advance above the 84.00 handle and the upper Bollinger Band, which stands near the 61.8% Fibonacci, could open the door for bullish actions towards the 85.25 resistance. Even higher, resistance would be faced around the 85.25 peak, registered on March 1.
However, a significant step lower, below the 40- and 20-SMAs as well as beneath the 50.0% Fibonacci of 82.90 could push the price until the lower Bollinger band of 81.80 and the 38.2% Fibonacci of 81.42.
Overall, a daily close below these lines and the 81.25 support, could confirm the long-term negative momentum.
Signal2forex reviews
 Signal2forex.com - Best Forex robots and signals


