
📑 Table of Contents
1. What Are Support and Resistance Levels?
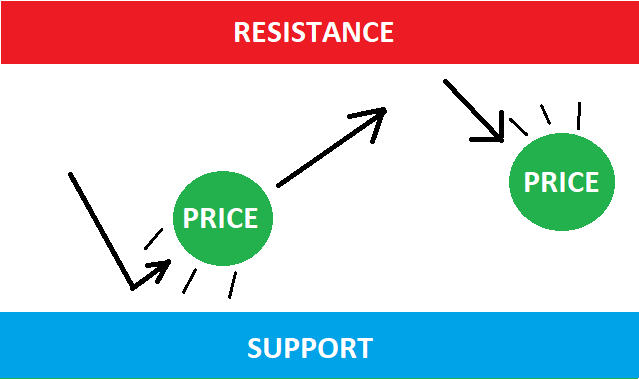
Support and resistance are fundamental concepts in technical analysis that form the backbone of price action trading. These are key price levels where the price of an asset tends to stop and reverse direction due to the concentration of buying or selling pressure.
A support level is a price point where buying interest is strong enough to overcome selling pressure, preventing the price from falling further. Think of it as a “floor” that supports the price. A resistance level is the opposite — a price point where selling interest is strong enough to overcome buying pressure, preventing the price from rising further. Think of it as a “ceiling” that the price struggles to break through.
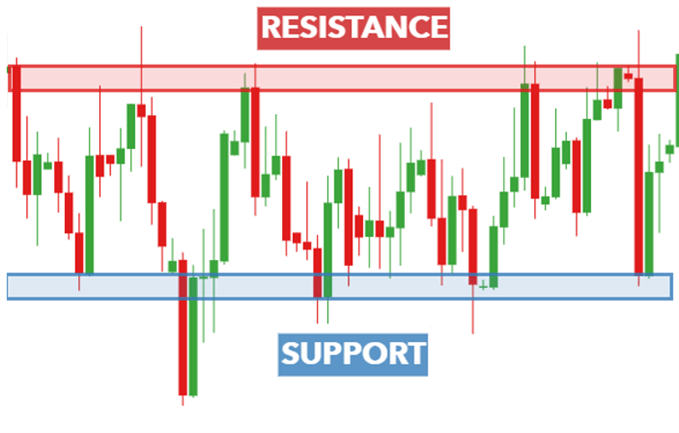
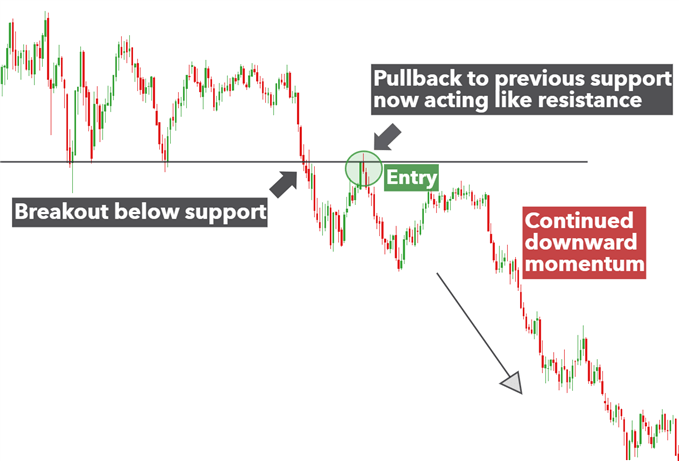
These levels are not exact lines but rather zones or areas where price action has historically reversed. The more times a level has been tested and held, the stronger it becomes. When a support level is broken, it often becomes resistance — and vice versa. This is known as the “role reversal” principle.
2. How to Identify Support and Resistance Levels
Identifying support and resistance levels is both an art and a science. There are several methods traders use to find these key levels, each with its own strengths and weaknesses.
Horizontal Levels
This is the most common and straightforward method. Look for areas on the chart where price has reversed multiple times in the past. These are typically swing highs (resistance) and swing lows (support). The more touches a level has, the more significant it becomes. Tip: Draw levels on higher timeframes (daily, weekly) first, as these are more significant than levels on lower timeframes.
Trendlines and Dynamic Levels
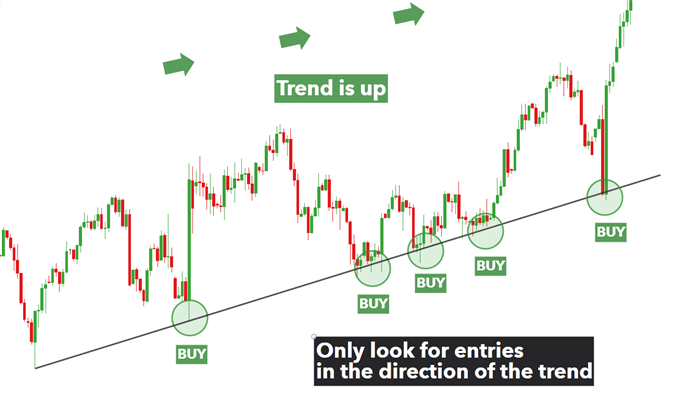
Trendlines connect a series of ascending swing lows (support) or descending swing highs (resistance). Unlike horizontal levels, trendlines are diagonal and slope with the trend. They represent dynamic support and resistance that moves with price over time.
Psychological Levels
Round numbers like 1.2000, 100.00, or 50.00 often act as support or resistance because traders and algorithms place orders at these psychologically significant levels. These levels are particularly important in forex and index trading.
Volume-Based Levels
Areas with high trading volume indicate where significant buying or selling has occurred. These levels often become support or resistance because traders who entered positions there may look to exit if price returns to that level. Volume profile and point-of-control (POC) levels are useful tools for identifying these zones.
3. Types of Support and Resistance
Not all support and resistance levels are created equal. Different types of levels serve different purposes and have varying degrees of reliability. The table below outlines the main types you’ll encounter.
| Type | Description | Best Timeframe | Reliability |
|---|---|---|---|
| Horizontal Levels | Price levels where price has reversed multiple times | All timeframes | High |
| Trendlines | Diagonal lines connecting swing highs/lows | Medium-High | Medium-High |
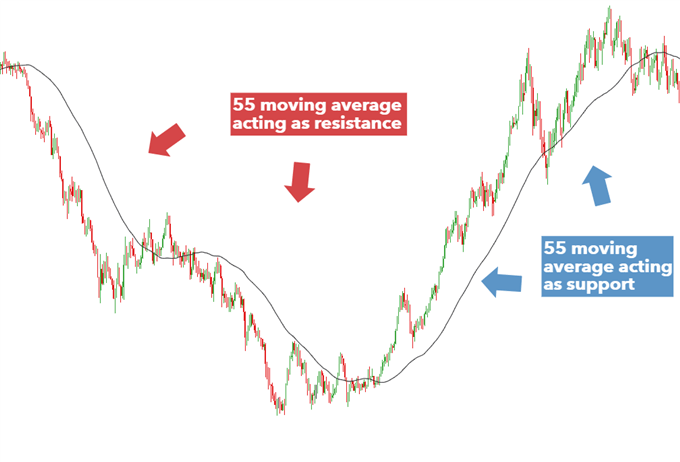
| Moving Averages | Dynamic support/resistance (e.g., 50, 100, 200 EMA) | Medium-High | Medium |
| Psychological Levels | Round numbers (e.g., 1.2000, 100.00) | All timeframes | Medium |
| Volume-Based Levels | Areas with high trading activity | Any | High |
| Pivot Points | Calculated from previous period’s high/low/close | Short-term | Medium |
📌 Higher timeframes generally produce more reliable levels. Weekly and daily levels are considered the strongest.
4. Support and Resistance Trading Strategies
There are several proven ways to trade support and resistance levels. The key is to choose the right strategy for the current market condition and to always use proper risk management.
Bounce Strategy (Range-Bound Markets)
This strategy works best in sideways or ranging markets. The idea is simple: buy at support and sell at resistance. Look for price action confirmation such as bullish pin bars, engulfing patterns, or bullish divergence at support. At resistance, look for bearish reversal signals. Place your stop-loss just beyond the level and target the opposite side of the range.
Breakout Strategy (Trending Markets)
When price breaks through a key support or resistance level with strong momentum and volume, it often continues in that direction. Enter on the breakout after the level has been clearly broken. Place your stop-loss just beyond the broken level and target the next significant level. Be cautious of false breakouts — wait for confirmation with a close beyond the level.
Retest Strategy
After a breakout, price often returns to retest the broken level. When support becomes resistance (or vice versa), this retest provides a high-probability entry. Enter when price retests the level and shows rejection. This strategy offers excellent risk-reward ratios as you can place a tight stop-loss just beyond the level.
Combining with Other Indicators
Support and resistance levels become more powerful when combined with other indicators. Popular combinations include:
- Support/Resistance + RSI: Look for bullish divergence at support or bearish divergence at resistance
- Support/Resistance + Moving Averages: Use moving averages to confirm the trend direction
- Support/Resistance + Candlestick Patterns: Wait for reversal patterns like hammer, engulfing, or pin bars at key levels
5. Common Mistakes to Avoid
Even experienced traders make mistakes when trading support and resistance. Here are the most common pitfalls and how to avoid them.
- Drawing Too Many Levels: Cluttering your chart with too many lines makes it difficult to identify the most significant levels. Focus on the strongest levels — those that have been tested multiple times on higher timeframes.
- Treating Levels as Exact Lines: Support and resistance are zones, not exact lines. Price can overshoot or undershoot a level by several pips before reversing. Use zones rather than precise lines for your entries and stop-losses.
- Ignoring Higher Timeframe Context: A level that looks significant on a 5-minute chart may be meaningless on the daily chart. Always check higher timeframes to confirm the importance of a level.
- Entering Without Confirmation: Entering a trade simply because price touched a level is a common mistake. Wait for price action confirmation such as a reversal candle, divergence, or a retest.
- Placing Stops Too Tight: Placing your stop-loss too close to a level increases the risk of being stopped out by normal market noise. Give the trade room to breathe by placing stops beyond the zone.
- Failing to Adjust Levels: Levels are not static. As price moves and new highs or lows are formed, levels should be adjusted accordingly. Regularly review and update your levels.
6. Support and Resistance vs Other Analysis Tools
Support and resistance is a foundational concept, but it is not the only tool available. The table below compares it with other popular analysis tools to help you understand when to use each.
| Tool | Purpose | Strength | Weakness |
|---|---|---|---|
| Support/Resistance | Identify key price levels | Simple, universal, works in all markets | Can be subjective |
| Trendlines | Identify trend direction | Visual, clear, shows momentum | Can be subjective, requires practice |
| Fibonacci Retracement | Identify potential reversal levels | Objective levels, widely followed | Requires swing points, less reliable in strong trends |
| Moving Averages | Dynamic support/resistance | Objective, dynamic, follows price | Lagging indicator, slower to react |
| Pivot Points | Identify potential turning points | Objective, mathematical | Short-term focus, less effective on higher timeframes |
📌 Support and resistance works best when combined with other tools. No single tool should be used in isolation.
7. Frequently Asked Questions
What are support and resistance levels in trading?
Support and resistance are key price levels where the price of an asset tends to stop and reverse. Support is a level where buying pressure prevents further decline, while resistance is a level where selling pressure prevents further rise.
How do you identify support and resistance levels?
Support and resistance levels are identified by looking at historical price charts and finding areas where price has reversed multiple times. Higher timeframes provide stronger levels. Look for swing highs and lows, round numbers, and areas of high trading volume.
What happens when support or resistance is broken?
When support is broken, it often becomes resistance (and vice versa). This is called the “role reversal” principle. A breakout with high volume is considered more reliable than one with low volume.
What is the difference between support/resistance and supply/demand?
Support/resistance are levels where price has reversed historically. Supply/demand zones are areas where institutional orders are clustered. Supply/demand zones are typically wider and considered more significant.
What is the best timeframe for support and resistance trading?
Higher timeframes (daily, weekly) provide stronger, more reliable levels. Lower timeframes (1-minute, 5-minute) can be used for precise entries but levels are less reliable.
Should I place stop-loss at support or resistance levels?
For long positions, place stop-loss just below the support level. For short positions, place stop-loss just above the resistance level. This protects against false breaks while allowing for market noise.
What are the most common mistakes in support and resistance trading?
Common mistakes include: drawing too many levels, treating levels as exact lines rather than zones, ignoring higher timeframe context, and entering trades without confirmation signals.
How can I confirm support and resistance levels?
Confirm levels by looking for: multiple touches at the same price, increased volume at the level, price action signals (pin bars, engulfing patterns), and alignment with other indicators like RSI or MACD.
Can support and resistance be used in all markets?
Yes, support and resistance concepts apply to all markets — forex, stocks, commodities, and cryptocurrencies. The principles of supply and demand are universal across all traded assets.
What is a false breakout in support and resistance trading?
A false breakout occurs when price briefly breaks through a support or resistance level but quickly reverses back. False breakouts often trap traders who enter on the initial break, making them important to identify and potentially trade.
🤖 Automate Your Support/Resistance Strategy: For traders looking to implement systematic trading around key levels, explore the Scalper EURUSD M5 forex robot — an automated trading solution designed for the EURUSD pair on the 5-minute timeframe. This EA combines scalping techniques with support and resistance-based entries, delivering consistent performance with an average trade duration of 15 minutes to 16 hours. It includes 8 indicators and automatic take-profit and stop-loss management, making it an ideal tool for traders who want to automate their support/resistance strategy.
📊 Discover More Trading Solutions: Browse our complete collection of forex trading robots and Expert Advisors — fully automated systems designed to execute a variety of strategies, including trend following, scalping, and portfolio trading. With over 14 proven EAs available, you can find the perfect automated solution to complement your support and resistance analysis. Our robots trade 24/7, eliminate emotional decision-making, and have been tested across multiple market conditions.



 Signal2forex.com - Best Forex robots and signals


