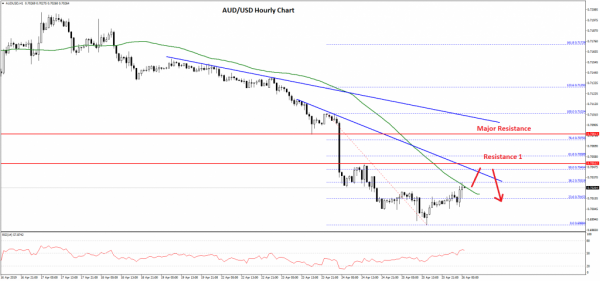
AUD/USD started an upside correction after trading below the 0.7000 level. NZD/USD recovered nicely above 0.6620, but it seems to be approaching a major hurdle near the 0.6660 area.
Important Takeaways for AUD/USD and NZD/USD
- The Aussie Dollar declined heavily and even spiked below the 0.7000 support against the US Dollar.
- There is a major bearish trend line in place with resistance at 0.7040 on the hourly chart of AUD/USD.
- NZD/USD started a strong upward move after it tested the 0.6580 support area.
- There was a break above a key bearish trend line with resistance at 0.6605 on the hourly chart.
AUD/USD Technical Analysis
There was a strong downward move in the Aussie Dollar from the 0.7150 resistance area against the US Dollar. The AUD/USD pair broke the 0.7080 support level to start a major downtrend.
The pair gained bearish momentum below the 0.7050 support and the 50 hourly simple moving average. There was even a spike below the 0.7000 support and the pair traded as low as 0.6988 on FXOpen.
Recently, it started an upside correction and traded above the 0.7000 resistance and the 23.6% Fib retracement level of the recent decline from the 0.7102 high to 0.6988 low. At the moment, the pair is facing resistance near the 0.7030 level and the 50 hourly simple moving average.
Moreover, there is a major bearish trend line in place with resistance at 0.7040 on the hourly chart of AUD/USD. The trend line is near the 50% Fib retracement level of the recent decline from the 0.7102 high to 0.6988 low.
Therefore, it won’t be easy for buyers to clear the 0.7030 and 0.7040 resistance levels. Above 0.7040, the next major resistance is near 0.7090 and another bearish trend line on the same chart.
On the downside, an initial support is at 0.7010, below which the pair could break the 0.7000 support once again. The next major support is near the 0.6975 level.
NZD/USD Technical Analysis
The New Zealand Dollar declined steadily from the 0.6688 swing high against the US Dollar. The NZD/USD pair broke the 0.6600 support level before buyers took a stand near the 0.6580 level.
A swing low was formed at 0.6580 and recently the pair climbed above the 0.6600 level. There was a break above a key bearish trend line with resistance at 0.6605 on the hourly chart.
The pair even broke the 0.6620 resistance and the 50 hourly simple moving average. More importantly, there was a break above the 50% Fib retracement level of the recent decline from the 0.6688 high to 0.6580 low.
An immediate resistance is near 0.6650 and the 61.8% Fib retracement level of the recent decline from the 0.6688 high to 0.6580 low. However, the main resistance is near the 0.6660 area, which was a major support earlier and now it could prevent gains.
On the downside, an initial support is near the 0.6625 level. The main support is near 0.6610 and the 50 hourly SMA. If NZD/USD fails to stay above the 50 hourly SMA, there is a risk of a sharp drop towards the 0.6580 or 0.6550 support level in the near term. Today’s GDP release in the US is likely to impact the market sentiment for EUR/USD, GBP/USD, USD/CHF, AUD/USD, NZD/USD and other major pairs.


 Signal2forex.com - Best Forex robots and signals


