
📑 Table of Contents
- 1. What Are Technical Analysis Charts?
- 2. The 3 Main Types of Trading Charts
- 3. Candlestick Charts — The Most Popular
- 4. Bar Charts — The Professional Choice
- 5. Line Charts — Simple and Clean
- 6. How to Choose the Right Chart for Your Trading Style
- 7. Technical Analysis Charts Comparison Table
- 8. Quick Reference Guide
- 9. Common Mistakes When Using Trading Charts
- 10. Frequently Asked Questions
1. What Are Technical Analysis Charts?
Technical analysis charts are visual representations of price data that help traders analyse market movements and make informed trading decisions. They display price action over a specific period, allowing traders to identify trends, patterns, and potential entry and exit points.
Charts are the foundation of technical analysis. They provide a visual history of price movements, enabling traders to apply various analytical tools — from trendlines and support/resistance levels to complex indicators and oscillators. Understanding the different types of charts is essential for any trader, whether you are a beginner or a seasoned professional.
Choosing the right chart type can significantly impact your trading decisions. Each chart type offers a different perspective on price data, and the best choice depends on your trading style, experience level, and analytical preferences.
2. The 3 Main Types of Trading Charts
There are three main types of charts used in technical analysis: candlestick charts, bar charts, and line charts. Each type displays price data differently and offers unique advantages and disadvantages.
| Feature | Candlestick Chart | Bar Chart | Line Chart |
|---|---|---|---|
| Best For | Forex, stocks, indices, commodities | Forex, stocks, indices, commodities | Stocks |
| Experience Level | Intermediate | Intermediate | Beginner |
| Information Displayed | Open, High, Low, Close (OHLC) | Open, High, Low, Close (OHLC) | Closing prices only |
| Visual Appearance | Full candles with body and wicks | Vertical bars with left/right dashes | Continuous line connecting closes |
| Ease of Reading | Very easy — colour-coded | Moderate | Very easy |
| Key Advantage | Easy to read, colour-coded sentiment | Cleaner view, less visual noise | Simplifies market view, reduces emotion |
| Key Disadvantage | Can be visually overwhelming | Less intuitive than candlesticks | Lacks detail (no open/high/low) |
📌 Each chart type has its strengths and weaknesses. The best choice depends on your trading style, experience level, and analytical preferences.
3. Candlestick Charts — The Most Popular
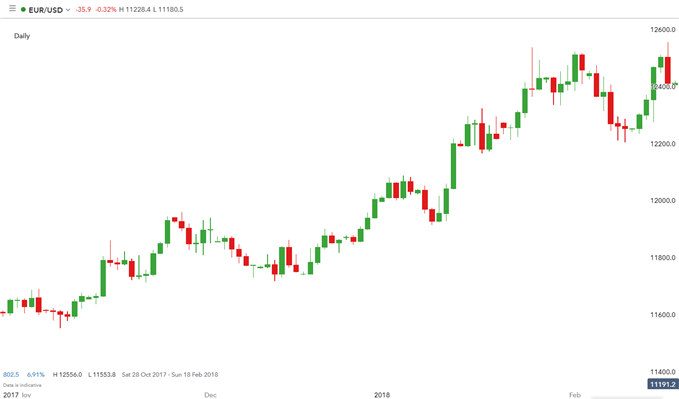
Candlestick charts are the most popular type of chart in forex and stock trading. They display the open, high, low, and close prices for each period using a visual format that is easy to read at a glance.
Each candlestick consists of a body (the range between the open and close) and wicks (the high and low). Bullish candles (green or white) close higher than they open, while bearish candles (red or black) close lower than they open. The colour coding provides instant visual feedback on market sentiment.
Candlestick charts are particularly effective for identifying patterns — formations like doji, hammer, engulfing, and harami that can signal potential reversals or continuations. Their visual nature makes them the preferred choice for most traders, from beginners to professionals.
4. Bar Charts — The Professional Choice
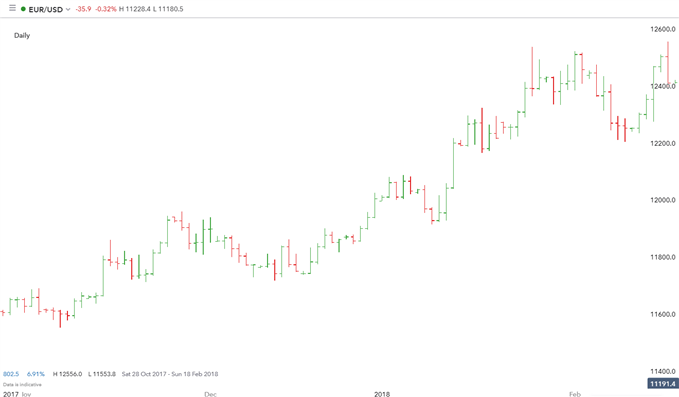
Bar charts are often preferred by professional traders for their clean, uncluttered appearance. Each bar displays the high and low as a vertical line, with a left dash indicating the open and a right dash indicating the close — collectively known as HLOC (High, Low, Open, Close).
Bar charts provide the same information as candlestick charts but in a more compact format. They are less visually overwhelming, making them ideal for traders who want to focus on price action without the distraction of coloured bodies.
Many professional traders prefer bar charts for their clarity and precision. When you are analysing multiple timeframes or complex setups, the cleaner view of a bar chart can be an advantage over the more visually busy candlestick chart.
5. Line Charts — Simple and Clean
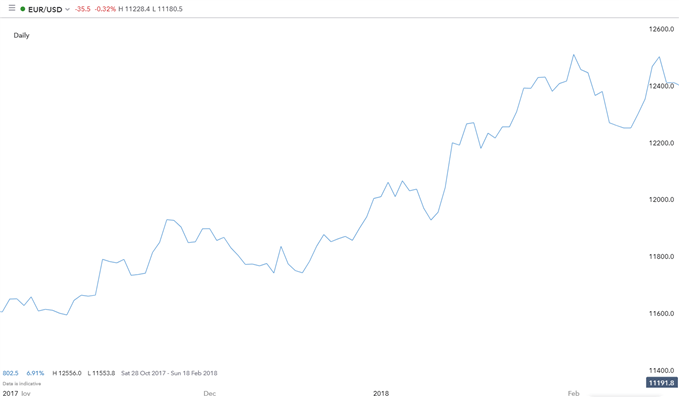
Line charts are the simplest type of chart. They display only the closing price for each period, with each closing price connected to the previous one by a continuous line. This creates a clean, smooth visual that is easy to follow.
Line charts are ideal for beginners who are just learning to read charts. They eliminate the noise of intra-period price movements and provide a clear view of the overall trend. Line charts are also useful for long-term trend analysis, as they focus on what matters most — the closing price.
However, the simplicity of line charts comes at a cost — they lack detail. Without open, high, and low prices, line charts cannot be used for detailed technical analysis or pattern recognition. They are best used as a starting point or for a quick overview of market direction.
6. How to Choose the Right Chart for Your Trading Style
Choosing the right chart type depends on your experience level, trading strategy, and personal preferences. Here are some guidelines to help you decide.
- If you are a beginner: Start with a line chart. It is simple, easy to understand, and helps you focus on the overall trend without getting overwhelmed by detail.
- If you are an intermediate trader: Move to candlestick charts. They provide the visual clarity you need to identify patterns and make informed decisions.
- If you are a professional trader: Consider bar charts. They offer a cleaner view of price data and are preferred by many professionals for their precision and lack of visual clutter.
- If you trade forex: Candlestick charts are the most popular choice among forex traders due to their visual clarity and pattern recognition capabilities.
- If you trade stocks: All three chart types are used, but candlestick and bar charts are more common among active traders.
7. Technical Analysis Charts Comparison Table
This static comparison table provides a quick reference for choosing the right chart type based on your needs.
| Feature | Candlestick Chart | Bar Chart | Line Chart |
|---|---|---|---|
| Best For | Forex, stocks, indices, commodities | Forex, stocks, indices, commodities | Stocks |
| Experience Level | Intermediate | Intermediate | Beginner |
| Information Displayed | Open, High, Low, Close (OHLC) | Open, High, Low, Close (OHLC) | Closing prices only |
| Visual Appearance | Full candles with body and wicks | Vertical bars with left/right dashes | Continuous line connecting closes |
| Ease of Reading | Very easy — colour-coded | Moderate | Very easy |
| Key Advantage | Easy to read, colour-coded sentiment | Cleaner view, less visual noise | Simplifies market view, reduces emotion |
| Key Disadvantage | Can be visually overwhelming | Less intuitive than candlesticks | Lacks detail (no open/high/low) |
📌 Use this table to quickly compare the three chart types and choose the one that best fits your trading style and experience level.
8. Quick Reference Guide
Use this quick reference guide to find the best chart type for your specific needs.
| Question | Recommendation |
|---|---|
| Best chart for beginners? | Line Chart — simple and easy to understand |
| Best chart for forex trading? | Candlestick Chart — most popular and informative |
| Best chart for professional analysis? | Bar Chart — cleaner view with full data |
| Best chart for identifying patterns? | Candlestick Chart — visual patterns are easier to spot |
| Best chart for long-term trends? | Line Chart — eliminates short-term noise |
📌 These recommendations are based on common trading practices. The best chart for you ultimately depends on your personal preference and trading style.
9. Common Mistakes When Using Trading Charts
Avoid these common pitfalls to improve your chart analysis.
- ❌ Using the wrong timeframe: Choosing a timeframe that doesn’t match your trading style can lead to poor decisions. Scalpers need short timeframes, while position traders need longer ones.
- ❌ Cluttering your chart with too many indicators: Overloading your chart with indicators can make it difficult to see the underlying price action. Keep it clean and focused.
- ❌ Ignoring the bigger picture: Always check higher timeframes to understand the broader trend before making decisions on lower timeframes.
- ❌ Not adjusting for market conditions: Different chart types work better in different market conditions. Be flexible and adjust your approach as needed.
- ❌ Focusing too much on the past: Charts show historical data, but the market is always evolving. Use charts as a guide, not a guarantee.
10. Frequently Asked Questions
What are the 3 main types of technical analysis charts?
The three main types are candlestick charts, bar charts, and line charts. Each displays price data differently — candlestick and bar charts show open, high, low, and close prices, while line charts show only closing prices.
Which chart is best for beginners?
Line charts are best for beginners because they are simple and easy to understand. They show only closing prices and eliminate short-term market noise.
What is the difference between a candlestick chart and a bar chart?
Both show open, high, low, and close prices. The main difference is visual — candlestick charts use coloured bodies with wicks, making them easier to read at a glance. Bar charts use vertical lines with left and right dashes for open and close.
Which chart is most popular in forex trading?
Candlestick charts are the most popular in forex trading because they provide more visual information while remaining easy to read at a glance. The colour coding helps traders quickly identify bullish and bearish sentiment.
What is a bar chart in technical analysis?
A bar chart displays the high, low, open, and closing prices (HLOC) for each period. The vertical line shows the high and low, the left dash shows the open, and the right dash shows the close.
What is a line chart in technical analysis?
A line chart displays only closing prices, with each closing price connected to the previous one by a continuous line. It is the simplest type of chart and is often used for viewing long-term trends.
How do I choose the right chart for trading?
Choose based on your experience level and trading strategy. Beginners should start with line charts. Intermediate traders often prefer candlestick charts for their visual clarity. Professional traders may use bar charts for a cleaner view of price data.
Can I use multiple chart types in my analysis?
Yes, many traders use multiple chart types. For example, you might use a line chart for long-term trend analysis and a candlestick chart for short-term entry and exit decisions.
What is the best chart for identifying patterns?
Candlestick charts are the best for identifying patterns because their visual nature makes it easier to spot formations like doji, hammer, engulfing, and other candlestick patterns.
📈 Enhance your chart analysis with powerful tools: Explore our collection of forex indicators for free download — essential technical analysis tools that help you interpret price action, identify trends, and make informed trading decisions on your MT4 or MT5 charts.
📊 Master the patterns you see on your charts: Learn how to trade the piercing line pattern — a complete trading guide. This bullish reversal candlestick pattern is easy to identify on candlestick charts and offers favourable risk-reward ratios when combined with proper technical analysis.
📞 Need help with your chart analysis? Our team is here to assist you. Visit our Contact Page or use the online chat available on every page of our website for immediate support.



 Signal2forex.com - Best Forex robots and signals


