
📑 Table of Contents
- 1. What Is a Piercing Line Pattern?
- 2. How to Identify a Piercing Pattern on Forex Charts
- 3. Piercing Line vs. Bullish Engulfing vs. Dark Cloud Cover
- 4. How to Trade the Piercing Line Pattern — Step-by-Step Strategy
- 5. Piercing Line Trading Checklist
- 6. Real Trading Example — Piercing Line on EUR/USD
- 7. How Reliable Is the Piercing Line Pattern?
- 8. Common Mistakes When Trading Piercing Patterns
- 9. Frequently Asked Questions
1. What Is a Piercing Line Pattern?
The piercing line pattern is a bullish reversal candlestick pattern that forms at the bottom of a downtrend. It frequently prompts a reversal in trend as bulls enter the market and push prices higher.
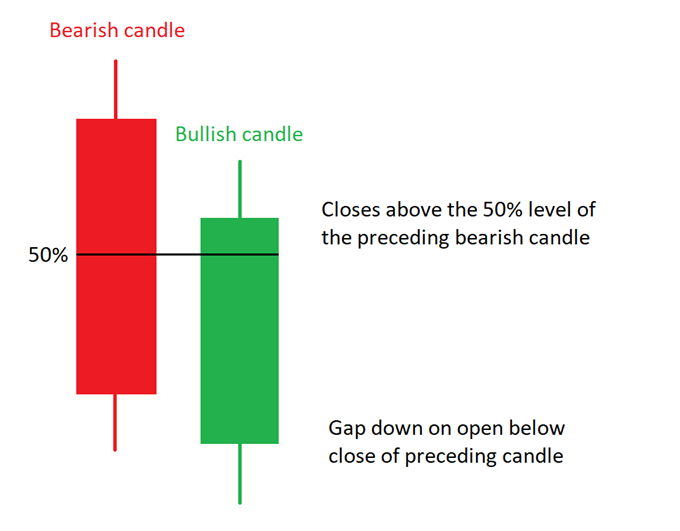
The piercing pattern involves two candlesticks with the second bullish candlestick opening lower than the preceding bearish candle. This is followed by buyers driving prices up to close above 50% of the body of the bearish candle.
This pattern should not be used in isolation but rather in conjunction with other supporting technical tools to confirm the signal.
2. How to Identify a Piercing Pattern on Forex Charts
Key Characteristics of a Piercing Line
- Occurs at the bottom of a downtrend — The pattern forms after a sustained downward move.
- Includes a bearish and bullish candle — The first candle is bearish (red), the second is bullish (green).
- The bullish candle opens lower than the close of the bearish candle — This creates a gap down.
- Bullish candle then closes above the 50% level of the bearish candle body — This is the defining feature of the pattern.
What Does This Tell Traders?
- Potential trend reversal to the upside (bullish reversal) — The pattern signals that sellers are losing control.
- Bears (sellers) are losing impetus at this key price level — Buyers are stepping in with conviction.
Advantages of Trading the Piercing Line
- Easy to identify — Simple two-candle formation that both novice and experienced traders can spot.
- Possibility of favourable risk-reward ratios — Clear entry and stop-loss levels allow for strong risk management.
- Desirable entry levels — Can be obtained after confirmation of the piercing pattern.
3. Piercing Line vs. Bullish Engulfing vs. Dark Cloud Cover — Key Differences
Understanding the differences between these three patterns is essential for accurate identification and trading. The table below compares the piercing line with its closest counterparts — the bullish engulfing pattern and the dark cloud cover.
| Feature | Piercing Line | Bullish Engulfing | Dark Cloud Cover |
|---|---|---|---|
| Pattern Type | Bullish Reversal | Bullish Reversal | Bearish Reversal |
| Number of Candles | 2 | 2 | 2 |
| First Candle | Bearish (long) | Bearish | Bullish (long) |
| Second Candle | Bullish | Bullish | Bearish |
| Second Candle Open | Below first close | Below first close | Above first close |
| Second Candle Close | Above 50% of first body | Above first open | Below 50% of first body |
| Gap Required | Gap down | Gap down | Gap up |
| Signal Strength | Moderate | Strong | Moderate |
| Best Market Context | Downtrend | Downtrend | Uptrend |
| Success Rate | ~55–65% | ~60–70% | ~55–65% |
📌 Signal Strength indicates the relative reliability of each pattern. Success Rate is based on historical performance across multiple markets and timeframes.
4. How to Trade the Piercing Line Pattern — Step-by-Step Strategy
Trading the piercing line pattern requires a disciplined approach. Follow these five steps to maximise your chances of success.
Step 1 — Identify a Valid Piercing Line in a Downtrend
- Ensure the pattern forms at the bottom of a clear downtrend (lower lows and lower highs).
- Confirm the two-candle structure: a long bearish candle followed by a bullish candle that opens lower and closes above the 50% level of the first candle’s body.
Step 2 — Confirm the Signal with Technical Indicators
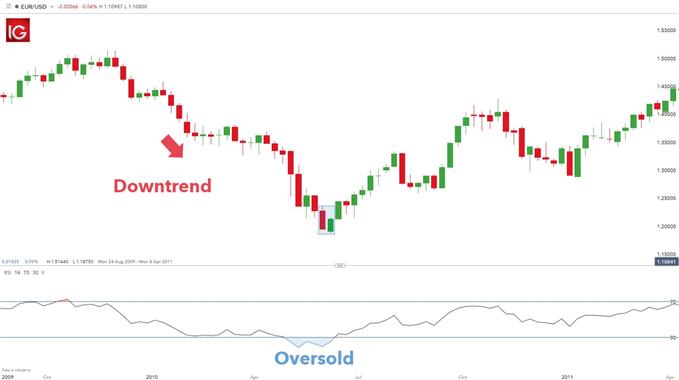
- RSI (Relative Strength Index): Look for an oversold reading (below 30) to reinforce the reversal signal.
- Moving Averages: Price should be above the long-term moving average (e.g., 200 MA) for additional confirmation.
- Support Levels: The pattern should form at or near a key support level or Fibonacci retracement level.
Step 3 — Enter the Trade
- Entry Signal: Enter a long position after the piercing line pattern is confirmed.
- Alternative Entry: Some traders wait for a retest of the pattern’s high or a breakout above the high of the second candle.
- Confirmation: Wait for the next candle to close in the direction of the reversal for additional confirmation.
Step 4 — Set Your Stop-Loss
- Stop-Loss Placement: Place your stop-loss below the low of the second candle (the bullish candle).
- Buffer: Add a small buffer below the low to account for market noise and avoid being stopped out prematurely.
- Risk Management: Never risk more than 1–2% of your trading account on a single trade.
Step 5 — Set Your Take-Profit
- Fibonacci Extensions: Use Fibonacci extensions (127.2%, 161.8%) to identify potential profit targets.
- Recent Swing Highs: Target the previous swing high or resistance level.
- Risk-Reward: Aim for a minimum risk-reward ratio of 1:2 to ensure profitable trading over the long term.
5. Piercing Line Trading Checklist
Before entering a trade based on the piercing line pattern, run through this static checklist to ensure you have covered all the key criteria.
| Step | Check | Status |
|---|---|---|
| 1 | Is the pattern in a clear downtrend? | ☑ Check |
| 2 | Is the first candle bearish with a long body? | ☑ Check |
| 3 | Does the second candle open below the first close? | ☑ Check |
| 4 | Does the second candle close above the 50% level of the first body? | ☑ Check |
| 5 | Is there a supporting indicator (RSI oversold, support level, moving average)? | ☑ Check |
| 6 | Is the risk-reward ratio at least 1:2? | ☑ Check |
| 7 | Is the stop-loss placed below the low of the second candle? | ☑ Check |
| 8 | Is the take-profit set using Fibonacci extensions or recent swing highs? | ☑ Check |
📌 Status indicates that each step should be verified before entering a trade. Missing any of these steps increases the risk of a losing trade.
6. Real Trading Example — Piercing Line on EUR/USD
Let’s walk through a realistic trading example using the piercing line pattern on the weekly EUR/USD chart.
Scenario: EUR/USD has been in a strong downtrend, making lower lows and lower highs. A piercing line pattern forms at a key support level near 1.0500.
Pattern Details:
- First Candle: A long bearish candle closes at 1.0480.
- Second Candle: The next candle opens lower at 1.0450 (gap down) but rallies strongly to close at 1.0520 — above the 50% level of the first candle’s body (1.0500).
- Confirmation: The RSI is oversold (below 30), reinforcing the reversal signal.
Trade Setup:
- Entry: Buy at 1.0525 (above the high of the second candle).
- Stop-Loss: Place stop-loss below the low of the second candle at 1.0440 (risk = 85 pips).
- Take-Profit: Target the previous swing high at 1.0700 (reward = 175 pips).
- Risk-Reward Ratio: 85 pips risk vs. 175 pips reward = approximately 1:2.06.
In this example, the trade reaches the target of 1.0700, delivering a profit of 175 pips with a well-defined risk-reward ratio.
7. How Reliable Is the Piercing Line Pattern?
The piercing line pattern signals bullish reversals; however, the reliability of this pattern alone is not recommended. Further support signals should be used in concurrence with the piercing pattern.
Success Rate: Historical data suggests that the piercing line pattern has a success rate of approximately 55–65% when confirmed with supporting indicators. Trading against a dominant trend can be risky, so finding multiple confirmation signals is encouraged to verify the pattern.
Factors That Increase Reliability:
- Higher Timeframes: The pattern is more reliable on daily, weekly, or 4-hour charts than on lower timeframes.
- Volume Confirmation: Increasing volume during the formation of the second candle strengthens the signal.
- Trend Context: The pattern is most reliable when it forms after a prolonged downtrend with clear lower lows.
- Support Level: The pattern is stronger when it forms at a key support level or Fibonacci retracement level.
💡 Trading tip: Never rely solely on the piercing line pattern. Always use it in combination with other technical tools such as RSI, moving averages, and support/resistance levels.
8. Common Mistakes When Trading Piercing Patterns
Avoid these common pitfalls to improve your success rate with piercing line patterns.
- ❌ Trading the pattern in isolation: The piercing pattern requires the use of other technical indicators and oscillators for confirmation.
- ❌ Ignoring the overall market trend: Looking at the overall market trend and not just the candlestick pattern in isolation is essential.
- ❌ Entering too early: Entering before the pattern is confirmed (e.g., waiting for the next candle) can lead to losses.
- ❌ Placing stop-loss too tight: Setting the stop-loss too close to the entry can result in being stopped out by normal market noise.
- ❌ Trading against a dominant trend: Trading against a dominant trend can be risky. Always look for multiple confirmation signals.
- ❌ Ignoring volume: Low volume during the pattern formation reduces the reliability of the signal.
9. Frequently Asked Questions
What is a piercing line pattern in trading?
A piercing line is a bullish reversal candlestick pattern that forms at the bottom of a downtrend. It consists of two candles: a long bearish candle followed by a bullish candle that opens lower but closes above the 50% level of the previous candle’s body.
How do you identify a piercing line pattern?
Look for a downtrend, a long bearish first candle, and a second bullish candle that opens below the first close but closes above the midpoint of the first candle’s body.
What is the difference between a piercing line and a bullish engulfing pattern?
In a piercing line, the second candle closes above the 50% level of the first candle but not above its open. In a bullish engulfing pattern, the second candle completely engulfs the first candle’s body.
How reliable is the piercing line pattern?
The piercing line pattern has a success rate of approximately 55–65% depending on market conditions, timeframe, and confirmation signals.
What is the best way to trade a piercing line pattern?
Enter after confirmation (e.g., RSI oversold, support level), place stop-loss below the low of the second candle, and set take-profit using Fibonacci extensions or recent swing highs.
What is the dark cloud cover pattern?
The dark cloud cover is the bearish counterpart to the piercing line. It forms in an uptrend and signals a potential bearish reversal.
Can the piercing line pattern be used in forex trading?
Yes, the piercing line pattern is widely used in forex trading and works on any timeframe, though it is most reliable on higher timeframes like daily or 4-hour charts.
What confirmation signals work best with the piercing line?
Common confirmation signals include RSI oversold conditions, support levels, moving averages, and bullish divergence.
📖 Expand your trading knowledge: Discover the truths and lies about forex trading — separate fact from fiction and learn what it really takes to become a consistently profitable trader.
📈 Master another powerful pattern: Learn how to trade engulfing candle patterns — how to trade them — a comprehensive guide to one of the most reliable reversal signals in technical analysis.
📞 Need help with your piercing line trading strategy? Our team is here to assist you. Visit our Contact Page or use the online chat available on every page of our website for immediate support.



 Signal2forex.com - Best Forex robots and signals


