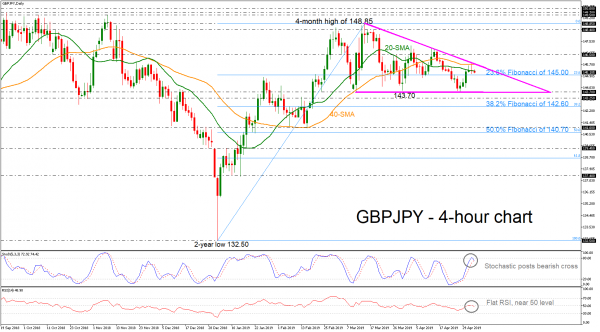
GBPJPY had a strong pullback on the downtrend line of the descending triangle around 145.85, which has been holding since March 14, sending prices slightly below the 20- and 40-simple moving averages (SMAs) in the 4-hour chart. From the technical point of view, the price could lose some momentum in the short-term as the RSI is flattening below the 50 level and the stochastic oscillator is ready for a bearish cross between the %K and %D lines.
If the 23.6% Fibonacci of the upleg from 132.50 to 148.85 near 145.00 proves easy to get through, the spotlight will turn to the 143.70 strong support zone. The bears would need to clear this area to pushthe price towards the 143.25 barrier and the 38.2% Fibonacci of 142.60.
On the other hand, a rebound on the 23.6% Fibonacci could send prices above the triangle formation towards the immediate resistance of 146.50, surpassing the 20- and 40-day SMAs. Should the price overcome that handle, resistance could run up to the 148.40 barrier and also the four-month high of 148.85 which may also be a challenge for the bulls.
In the medium-term picture, GBPJPY should resume its upside trend above the four-month high of 148.85, however a dive below the descending triangle pattern would bring the bearish outlook into play.
Signal2forex reviews
 Signal2forex.com - Best Forex robots and signals


