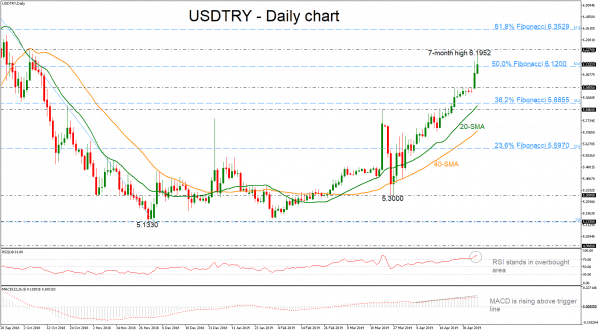
USDTRY has been in a flying mode today, reaching a new seven-month high of 6.1952. Looking at the technical indicators, the RSI is still hovering in the overbought area, suggesting a possible overstretched market in the daily chart, while the MACD rose above the trigger line, confirming the recent bullish tendency in price action.
If the market edges higher, the bullish action may pause initially near the 6.2270 resistance, registered on October 2018, while further gains could send prices until the 61.8% Fibonacci retracement level of the downleg from 7.1135 to 5.1330 around 6.3529.
On the other hand, dropping below the 50.0% Fibonacci of 6.1200 could see losses extending towards the 5.9855 support area. Even lower, the bears could stall around the 38.2% Fibonacci of 5.8855, slightly above the 20-day simple moving average (SMA).
The recent bullish action turned the weak momentum to a more aggressive one, with the price increasing distance above the shorter-term moving averages, so we could expect further improvement in the market.


 Signal2forex.com - Best Forex robots and signals


