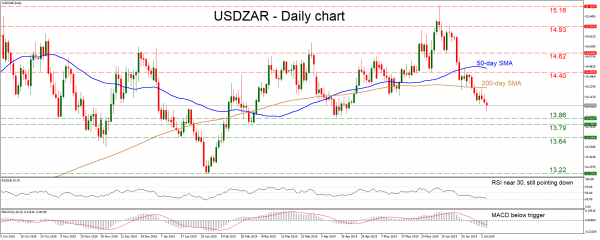
USDZAR has recorded significant losses in recent weeks, moving back below its 50- and 200-day simple moving averages (SMAs) to record a lower low on the daily chart. The picture therefore seems to be shifting to negative, though a clear break below the 13.86 – 13.79 zone is needed to confirm that.
Looking at momentum oscillators, the RSI endorses the negative picture as it is just above 30 and pointing down, while the MACD is also below its red trigger line.
Further declines could stall around the 13.86 – 13.79 zone, which halted the losses both in February and in April. If sellers pierce below it, that would solidify the bearish picture and open the door for 13.64 – the January 16 low.
On the other hand, a recovery in the pair may meet resistance around 14.22, where the 200-day SMA is located. An upside break could turn the attention to the 14.40 zone, marked by the inside swing low on June 4.
Summarizing, a decisive move below 13.79 would mark another lower low, confirming that a short-term downtrend is in progress.


 Signal2forex.com - Best Forex robots and signals


