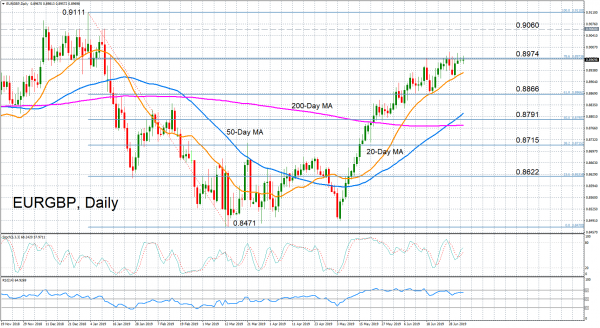
EURGBP has hit a strong wall at the 78.6% Fibonacci retracement of the downleg from 0.9111-0.8471 around 0.8974. Momentum indicators remain in bullish territory but are sending out mixed signals for the near-term picture. The stochastics are pointing upwards, suggesting further advances are possible in the coming days. However, the RSI has flatlined, indicating the latest upleg may have run its course.
If the positive momentum holds and prices manage to break above immediate resistance at the 78.6% Fibonacci, the 0.9060 level is likely to come into focus – a previous resistance area – before the bulls challenge the 0.91 handle. Above 0.91, the main target is January’s near 16-month high of 0.9111. If successfully broken, this would confirm the start of a longer-term uptrend for EURGBP and shift the outlook to a more convincingly bullish one.
At the moment, the bullish structure is still in its infancy, with the 50-day moving average having only recently crossed above the 200-day one.
However, if the pair continues to lose steam and prices reverse lower, the nearest support to watch is the 20-day MA at 0.8930. Dropping below the 20-day (MA) would open the way for the 61.8% Fibonacci at 0.8866, while a steeper slide towards the 50% Fibonacci at 0.8791 would erase the bullish bias and switch the short-term view to a more neutral one.

Recommend professional Forex robots


 Signal2forex.com - Best Forex robots and signals


