
📑 Table of Contents
1. What Is the Relative Strength Index (RSI)?
The Relative Strength Index (RSI) is a momentum oscillator developed by engineer, mathematician, and trader J. Welles Wilder in 1978. It measures the speed and change of price movements, oscillating between 0 and 100. The RSI is one of the most popular technical indicators used by traders to identify overbought and oversold conditions, as well as potential trend reversals.
Wilder created the RSI to address a common problem traders faced: timing entry and exit points. His formula grades price movement over a specified number of periods (typically 14) and compares the magnitude of recent gains to recent losses to determine market “strength” or momentum.

2. How Is RSI Calculated?
The RSI is calculated using a relatively straightforward formula, though modern trading platforms handle the computation automatically. Understanding the calculation helps traders appreciate what the indicator actually measures.
The RSI Formula
RSI = 100 − (100 / (1 + RS))
Where RS (Relative Strength) = Average Gain over a period / Average Loss over a period
The standard period is 14, though traders often adjust this based on their trading style and timeframe.
Understanding the 14-Period Setting
The default 14-period setting was chosen by Wilder based on his extensive backtesting. This setting works well for daily charts and provides a good balance between sensitivity and reliability. However, traders can adjust the period:
- Shorter periods (7–9): More sensitive, generate more signals, but also more false signals
- Longer periods (21–30): Less sensitive, generate fewer signals, but more reliable
Step-by-Step Calculation Example
To calculate a 14-period RSI, first compute the average gains and average losses over 14 periods. Then divide the average gain by the average loss to get the RS value, and finally apply the formula. This gives a reading between 0 and 100 that reflects the strength of recent price momentum.
3. How to Read the RSI Indicator
Reading the RSI involves understanding its key levels and what they signal about market conditions. The most common interpretation focuses on the 70 and 30 thresholds, but there is much more to the indicator than just overbought and oversold levels.
Overbought and Oversold Levels (70/30)
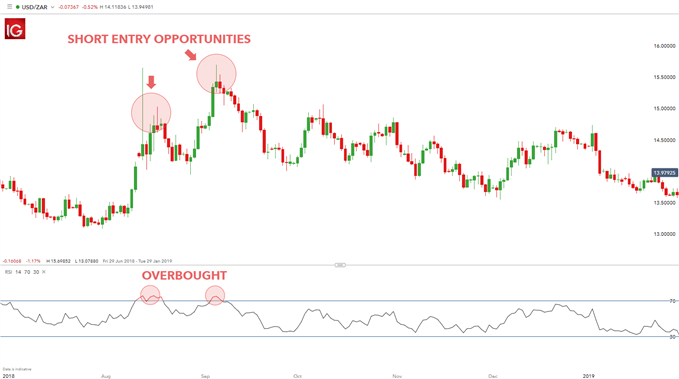
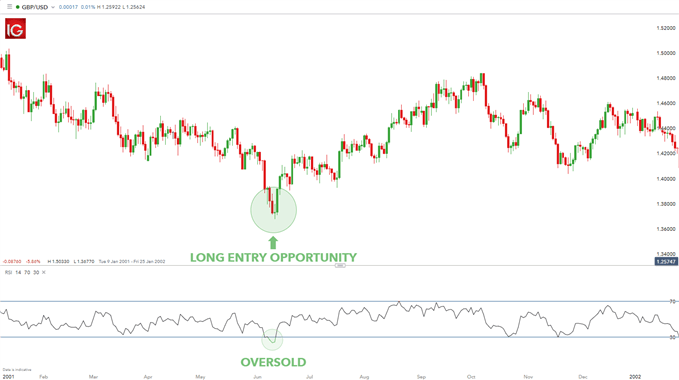
The RSI is traditionally considered overbought when above 70, suggesting the asset may be overvalued and due for a pullback. Conversely, it is considered oversold when below 30, suggesting the asset may be undervalued and due for a bounce.
Important: In strong trends, the RSI can remain overbought or oversold for extended periods. Therefore, overbought does not necessarily mean “sell” and oversold does not necessarily mean “buy” — context matters.
The 50 Level as a Trend Filter
The midline at 50 serves as a powerful trend filter. When the RSI is above 50, the trend is generally considered bullish; when below 50, the trend is bearish. Many traders use this as a primary filter: only take long signals when RSI is above 50, and only take short signals when RSI is below 50.
RSI Divergence: Spotting Reversals
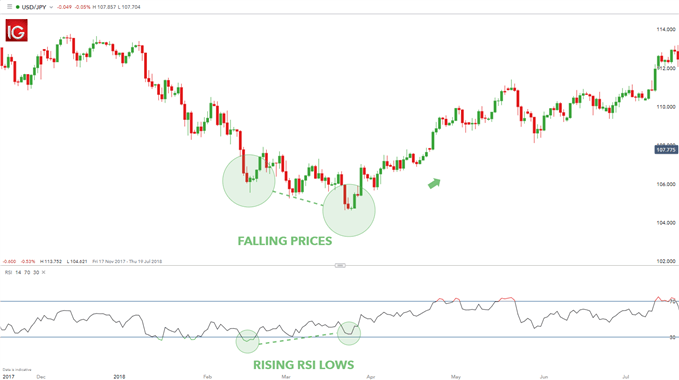
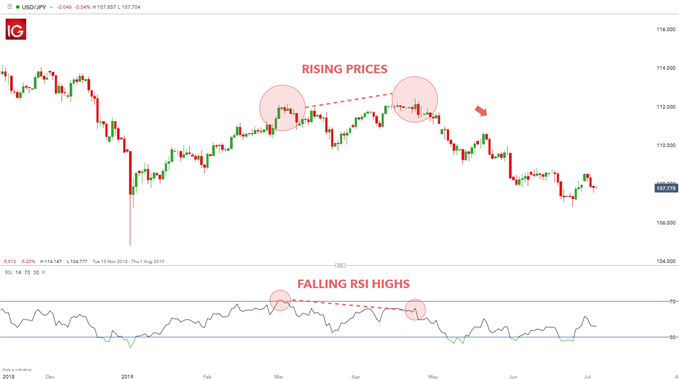
Divergence is one of the most valuable ways to use the RSI. It occurs when the price makes a new high or low that is not confirmed by the RSI:
- Positive (Bullish) Divergence: Price makes a lower low, but RSI makes a higher low — signals a potential reversal to the upside
- Negative (Bearish) Divergence: Price makes a higher high, but RSI makes a lower high — signals a potential reversal to the downside
4. RSI Trading Strategies
There are several effective ways to incorporate the RSI into a trading strategy. The key is to understand the context and combine RSI signals with other forms of analysis.
Overbought/Oversold Strategy
This is the most basic strategy: buy when RSI drops below 30 and sell when RSI rises above 70. However, this works best in ranging markets. In strong trends, wait for the RSI to move back above 30 (for buys) or below 70 (for sells) before entering.
Divergence Strategy
Divergence signals are among the most powerful RSI strategies. When you spot a positive divergence, look for long entries. When you spot a negative divergence, look for short entries. For best results, wait for price to confirm the divergence with a break of a trendline or a moving average.
RSI and Trend Confirmation
Use the RSI’s 50 level to confirm trend direction. In an uptrend, RSI should generally stay above 50; in a downtrend, it should stay below 50. Enter trades only when the RSI supports the trend direction.
Combining RSI with Other Indicators
The RSI works exceptionally well when combined with other indicators. Popular combinations include:
- RSI + Moving Averages: Use moving averages to identify the trend, and RSI for entry timing
- RSI + Support/Resistance: Look for RSI signals at key support/resistance levels for higher probability trades
- RSI + Candlestick Patterns: Combine RSI divergence with reversal candlestick patterns like hammer or engulfing
5. RSI vs Other Momentum Indicators
While the RSI is one of the most popular momentum oscillators, it is not the only one available. The table below compares the RSI with other common momentum indicators to help you choose the right tool for your trading style.
| Feature | RSI | Stochastic | MACD | CCI |
|---|---|---|---|---|
| Type | Momentum Oscillator | Momentum Oscillator | Trend-following | Momentum Oscillator |
| Range | 0–100 | 0–100 | Unlimited | ±100 to ±300 |
| Overbought Level | 70+ | 80+ | Varies | 100+ |
| Oversold Level | 30– | 20– | Varies | −100– |
| Best For | Identifying reversals | Short-term momentum | Trend confirmation | Cyclical markets |
| Divergence Use | Yes | Yes | Yes | Yes |
📌 Each indicator serves a different purpose. The RSI is best for identifying overbought/oversold levels and divergences, while the MACD is better suited for trend confirmation.
6. Common RSI Mistakes to Avoid
Even experienced traders can make mistakes when using the RSI. Here are the most common pitfalls and how to avoid them.
- Trading Every Overbought/Oversold Signal: In strong trends, the RSI can remain overbought or oversold for extended periods. Always consider the broader trend context before acting on RSI signals.
- Ignoring Divergence Confirmation: Divergence signals are more reliable when confirmed by price action, such as a trendline break or candlestick pattern.
- Using RSI in Isolation: No single indicator should be used in isolation. Combine RSI with other tools like moving averages, support/resistance, and volume for better results.
- Using the Wrong Period Setting: The standard 14-period setting works well for daily charts but may need adjustment for shorter or longer timeframes.
- Overlooking the 50 Level: The 50 level is a powerful trend filter. Ignoring it can lead to trading against the prevailing momentum.
7. Frequently Asked Questions
What is the Relative Strength Index (RSI)?
The Relative Strength Index (RSI) is a momentum oscillator developed by J. Welles Wilder that measures the speed and change of price movements. It oscillates between 0 and 100 and is used to identify overbought and oversold conditions.
How is the RSI calculated?
RSI is calculated using the formula: RSI = 100 − (100 / (1 + RS)), where RS = average gain over a period / average loss over a period. The standard period is 14.
What does RSI above 70 mean?
An RSI reading above 70 generally indicates overbought conditions, suggesting the asset may be overvalued and due for a pullback or reversal.
What does RSI below 30 mean?
An RSI reading below 30 indicates oversold conditions, suggesting the asset may be undervalued and due for a bounce or reversal.
What is RSI divergence?
RSI divergence occurs when the price makes a new high or low that is not confirmed by the RSI. Positive divergence (bullish) occurs when price makes a lower low but RSI makes a higher low, signaling a potential reversal to the upside.
What is the best RSI setting for day trading?
For day trading, a shorter period of 7–9 with overbought at 70+ and oversold at 30− is commonly used. Some traders prefer 9-period for more sensitive signals.
Can RSI be used for all markets?
Yes, the RSI can be employed in virtually any market — stocks, forex, commodities, and cryptocurrencies — making it an invaluable tool for traders.
What is the 50 level in RSI?
The 50 level in RSI is the midline. Readings above 50 suggest bullish momentum, while readings below 50 indicate bearish momentum. It acts as a trend filter.
How do you trade RSI divergence?
When positive divergence occurs (price makes lower low, RSI makes higher low), look for long entries. When negative divergence occurs (price makes higher high, RSI makes lower high), look for short entries.
What is the success rate of RSI?
The success rate of RSI depends on market conditions and the strategy used. When combined with other indicators and proper risk management, RSI can be highly effective, with studies showing 60–70% accuracy in trending markets.
Vad är Relative Strength Index (RSI)?
Relative Strength Index (RSI) är en momentumoscillator utvecklad av J. Welles Wilder som mäter hastigheten och förändringen av prisrörelser. Den oscillerar mellan 0 och 100 och används för att identifiera överköpta och översålda förhållanden.
Vad betyder RSI över 70?
Ett RSI-värde över 70 indikerar överköpta förhållanden, vilket tyder på att tillgången kan vara övervärderad och redo för en korrigering.
Vad betyder RSI under 30?
Ett RSI-värde under 30 indikerar översålda förhållanden, vilket tyder på att tillgången kan vara undervärderad och redo för en studs.
📊 Master Key Levels: Combine RSI signals with our comprehensive guide to support and resistance trading — learn how to identify key price levels that can significantly increase the accuracy of your RSI entries and exits.
🌍 Global Market Insights: Stay informed about major financial developments with our analysis of Absa’s wholesale banking expansion — understanding global banking trends can provide valuable context for your technical analysis and trading decisions.



 Signal2forex.com - Best Forex robots and signals


