The Euro and British Pound traded higher this week against the Japanese Yen. Both EUR/JPY and GBP/JPY are correcting lower, but dips remain well supported.
Important Takeaways for EUR/JPY and GBP/JPY
- The Euro spiked higher recently after it tagging the 120.00 support area against the Japanese Yen.
- There was a break above a major bearish trend line with resistance near 120.80 on the hourly chart of EUR/JPY.
- GBP/JPY is trading with a positive bias and remains well bid above the 135.00 level.
- There is a key bullish trend line forming with support near 134.80 on the hourly chart.
EUR/JPY Technical Analysis
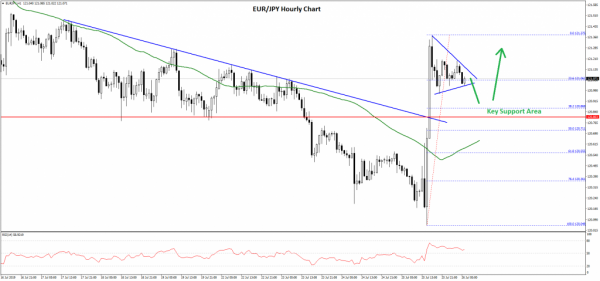
Earlier this week, the Euro declined steadily below the 121.00 support level against the Japanese Yen. The EUR/JPY pair even traded below the 120.50 support level and traded close to the 120.00 support level.
A swing low was formed near 120.04 on FXOpen and recently the pair jumped sharply higher. It broke the 120.50 resistance level and the 50 hourly simple moving average

Moreover, there was a break above a major bearish trend line with resistance near 120.80 on the hourly chart of EUR/JPY. The pair even settled above the 121.00 level and recently traded as high as 121.37.
It is currently correcting lower below the 121.20 level plus the 23.6% Fib retracement level of the last wave from the 120.04 low to 121.37 high. It seems like there is a short term breakout pattern forming with support near the 121.00 level.
If there is a downside break, the pair might correct towards the key 120.80 support level. The main support is near the 120.70 level and the 50% Fib retracement level of the last wave from the 120.04 low to 121.37 high.
Therefore, dips in EUR/JPY towards the 120.80 and 120.70 levels are likely to find a lot of buying interest in the near term. On the upside, the pair might face hurdles near the 121.50 and 121.80 levels.
GBP/JPY Technical Analysis
The British Pound followed a steady bullish path above 134.20 this week against the Japanese Yen. The GBP/JPY pair broke the key 134.60 resistance levels to extend its upside and move into a positive zone.
The pair climbed above the 135.00 resistance and the 50 hourly simple moving average. Finally, there was a break above the 135.50 level and the pair traded close to the 135.70 level.

A swing high was formed at 135.66 and the pair is currently correcting lower below 135.50. It is currently testing the 50% Fib retracement level of the last wave from the 134.70 low to 135.66 high.
On the downside, there are a few important supports near the 135.10 and 135.00 levels. The 61.8% Fib retracement level of the last wave from the 134.70 low to 135.66 high is also positioned near the 50 hourly simple moving average to act as a strong support above 135.00.
Moreover, there is a key bullish trend line forming with support near 134.80 on the hourly chart. Therefore, dips towards the 135.00 and 134.80 levels are likely to find a strong buying interest in the near term.
On the upside, an initial resistance is near the 135.40 level, above which the pair could climb higher towards the 135.70 and 136.00 levels in the coming sessions.
Recommend professional Forex robots


 Signal2forex.com - Best Forex robots and signals


