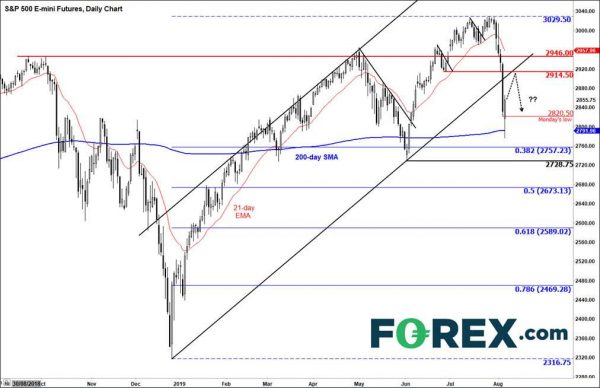
After yesterday’s bloodbath on Wall Street, index futures point to a rebound once trading gets underway shortly. European markets also staged a sharp recovery as sentiment improved. But it remains to be seen whether stocks will be able to push higher from here over the next few days, or the selling resumes. While the markets could recover a bit further, I remain sceptical that we will see new all-time highs any time soon. I think too much technical damage may have already incurred to suggest the bulls are still in control after a multi-month rally sent US indices to virgin territories and markets elsewhere to elevated levels, before the plunge that started last week. It is possible that a lot of people who bought near those record levels may use any rebounds as opportunities to close out their losing trades at breakeven or a small loss. Long-side liquidation will likely apply pressure on the indices.
In truth, a lot depends on the US-China trade dispute, which remains the main focal point after the US government formally named China a “currency manipulator” after the close of Wall Street on Monday. This came after Beijing allowed the renminbi to fall below 7 against the dollar for the first time in more than a decade, apparently in retaliation to the imposition of fresh tariffs on Chinese goods arriving in the US that were announced last week. However, after an initial dip on the news, stock index futures managed to rebound and were up noticeably at the time of writing. The People’s Bank of China set the daily currency fixing stronger than expected overnight, presumably to distance itself from the accusation it manipulates the yuan. Also supporting the markets is probably bargain hunting of companies with good fundamentals and short-covering elsewhere.
But unless something fundamentally changes regarding US-China trade dispute, I think that the path of least resistance remains to the downside for the global indices, despite today’s bounce. As such we expect key resistances to be defended and the selling to potentially resume later on in the week or possibly later on today. As the chart of the S&P 500 futures show, below, the index has now broken out of its bullish channel after taking out key support levels at 2946.00 and 2914.50. These levels are now going to be resistance, or potential resistance, to watch. On the downside, Monday’s low at 2820.50 is an important level to watch as the index has been able to climb back above it. So, it could turn into support. Below that, the 200-day average comes in at 2791.95, followed by the 38.2% Fib level at 2757.23.


 Signal2forex.com - Best Forex robots and signals


