
📑 Table of Contents
1. What Is an Andrews Pitchfork?
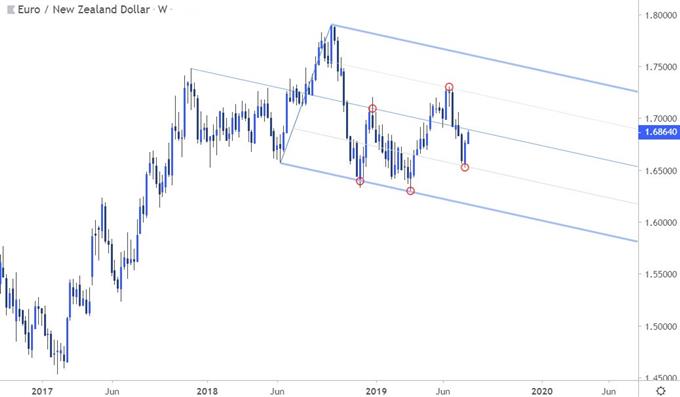
The Andrews Pitchfork, also known as the Median Line Method, is a powerful technical analysis tool developed by Dr. Alan Andrews in the 1960s. It is a trend-following indicator that uses three parallel lines to create a price channel, helping traders identify trends, support and resistance levels, and potential reversal points.
Unlike static horizontal support and resistance lines, the pitchfork adapts to the trend’s momentum, making it a dynamic tool that works across all asset classes — forex, stocks, commodities, and cryptocurrencies. The pitchfork answers three critical questions for traders: where the trend is heading, when to enter or exit a trade, and how much risk to take.

2. How Does the Pitchfork Work?
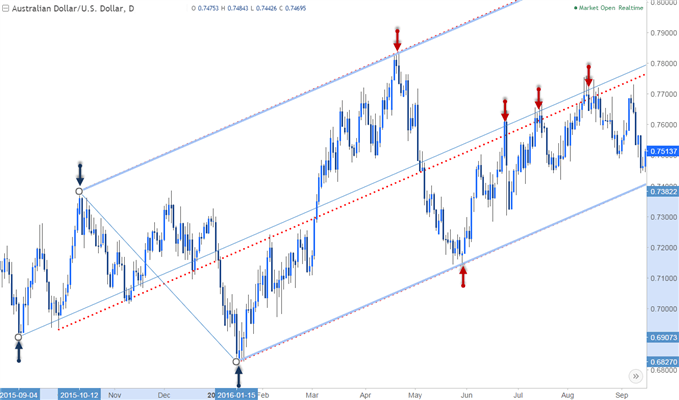
The Andrews Pitchfork is built on a core principle: price tends to return to the median line roughly 80% of the time. When price fails to reach the median, it may indicate that a reversal is developing.
The Three Lines Explained
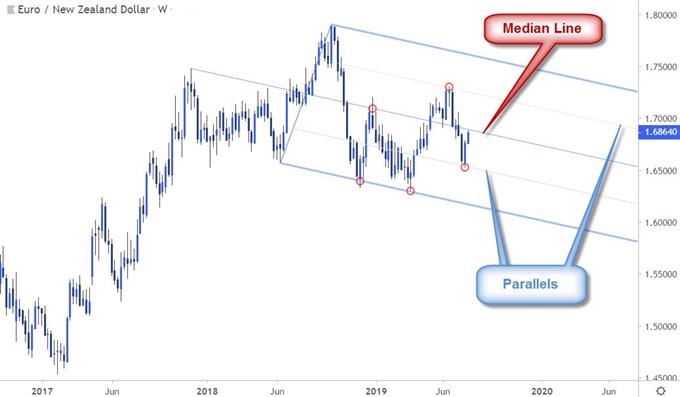
The pitchfork consists of three parallel lines:
- Median Line (ML) — the central line that follows the broad trend. It acts as a gravitational centre for price.
- Upper Parallel Line (UPL) — drawn above the median line, acts as resistance.
- Lower Parallel Line (LPL) — drawn below the median line, acts as support.
The 80% Median Line Principle
Dr. Alan Andrews recognised that market prices gravitate towards the median line approximately 80% of the time, with the remaining 20% accounted for by volatile fluctuations or changes in sentiment. When price moves away from the median, it tends to return — making the median line a natural target zone for traders.
Understanding Price Behaviour Within the Channel
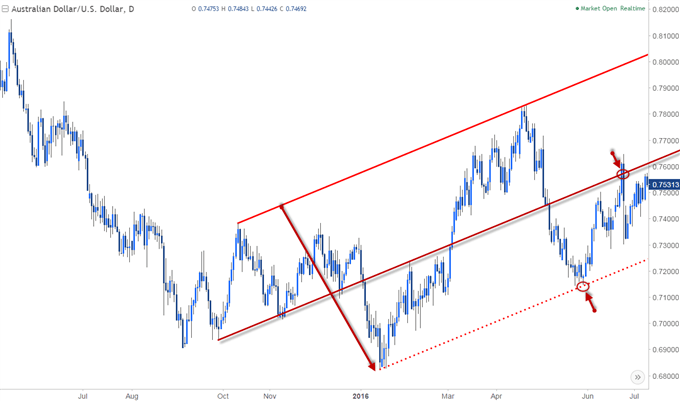
The upper and lower lines act as dynamic support and resistance levels. In an uptrend, the lower line often provides buying opportunities, while the upper line signals potential profit-taking areas. In a downtrend, the opposite applies.
3. How to Draw an Andrews Pitchfork
Drawing an Andrews Pitchfork correctly is essential for accurate analysis. The tool requires three pivot points that define the trend’s structure:
- Point A — The anchor, representing the start of the trend (a significant swing high or low)
- Point B — The first counter-trend swing (a reaction high or low in the opposite direction)
- Point C — The second swing, moving in the same direction as Point A
Step-by-Step Drawing Guide
Follow these steps to draw a pitchfork correctly:
- Identify the trend — determine whether the market is in an uptrend or downtrend
- Select Point A — mark the significant swing high (downtrend) or swing low (uptrend)
- Select Point B — mark the first counter-trend swing
- Select Point C — mark the second swing that confirms the trend direction
- Draw the median line — connect Point A to the midpoint between Points B and C
- Draw the parallel lines — the tool automatically draws lines through Points B and C, parallel to the median line
Common Drawing Mistakes
- Choosing the wrong pivot points — using insignificant swings will render the tool useless
- Forcing the pitchfork — if it doesn’t fit naturally, the trend may not be suitable for pitchfork analysis
- Ignoring higher timeframes — always confirm pitchfork validity on higher timeframes
- Not adjusting for variants — different market conditions may require Schiff or Modified Schiff variants
4. Pitchfork Variants
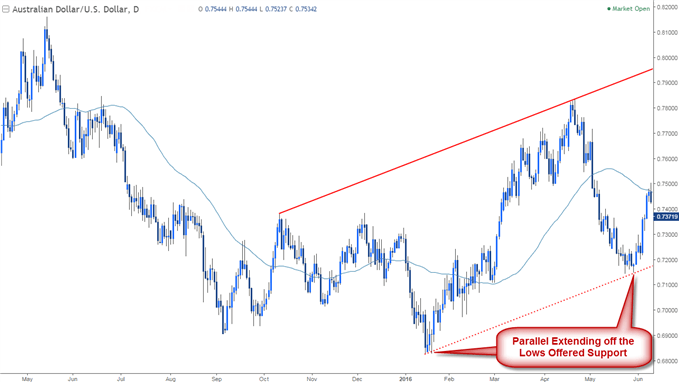
Three pitchfork variants are commonly used, each adjusting the anchor point position to accommodate different trend angles. The table below compares the main variants:
| Feature | Original (Andrews) | Schiff | Modified Schiff |
|---|---|---|---|
| Developer | Dr. Alan Andrews | Jerome Schiff (student of Andrews) | Unknown (further refinement) |
| Anchor Position | Remains at Point A | Shifts 50% toward B (price only) | Shifts 50% toward B (time and price) |
| Best Market | Strong trending markets | All markets, particularly volatile ones | Choppy/range-bound markets |
| Popularity | Most common | Moderate | Growing |
📌 Each variant adjusts the anchor point differently to accommodate various trend angles and market conditions.
5. Pitchfork Trading Strategies
Several effective strategies have been developed around the Andrews Pitchfork. The key is to understand the market context and use the pitchfork’s structure to identify high-probability trading opportunities.
Median Line Bounce Strategy
This strategy capitalises on the 80% median line reversion principle. When price moves away from the median and returns to it, traders look for a bounce. In an uptrend, buy when price reaches the median line from above; in a downtrend, sell when price reaches the median line from below.
Breakout Strategy
When price breaks through the upper or lower parallel lines with strong momentum, it often signals a trend acceleration. Enter in the direction of the breakout and place a stop-loss just beyond the broken line. A breakout indicates the start of a new trend and will eventually require a new pitchfork.
Reversal Strategy (When Price Fails to Reach the Median)
When price fails to reach the median line, it may indicate a trend acceleration or a reversal in development. If price turns away from the median, consider entering in the direction of the rejection.
Combining Pitchfork with Other Indicators
For enhanced accuracy, combine the pitchfork with other technical tools:
- Pitchfork + RSI — look for divergence at pitchfork boundaries
- Pitchfork + Moving Averages — use moving averages to confirm the trend direction
- Pitchfork + Fibonacci — use Fibonacci levels for additional confluence at pitchfork lines
6. Best Timeframes for Pitchfork Analysis
The reliability of a pitchfork varies significantly across timeframes. Higher timeframes produce fewer signals but carry greater significance due to broader market participation.
| Timeframe | Reliability | Best Use | Signal Frequency |
|---|---|---|---|
| 1‑Minute | Low | Not recommended | Very High |
| 5‑Minute | Low-Medium | Scalping | High |
| 15‑Minute | Medium | Day trading | Medium-High |
| 1‑Hour | Medium-High | Swing trading | Medium |
| 4‑Hour | High | Swing trading | Low-Medium |
| Daily | Very High | Position trading | Low |
| Weekly | Very High | Long-term analysis | Very Low |
📌 Pro Tip: The 4‑hour and daily timeframes offer the best balance between reliability and signal frequency. Avoid lower timeframes unless you are a professional scalper.
7. Pitchfork vs Other Technical Tools
While the pitchfork is a powerful tool, it is not the only one available. The table below compares the pitchfork with other popular technical analysis tools.
| Tool | Purpose | Strength | Weakness |
|---|---|---|---|
| Andrews Pitchfork | Identify trend channels and support/resistance | Dynamic, adaptive to trend momentum | Subjective pivot point selection |
| Trendlines | Identify trend direction | Simple, visual, clear | Can be subjective |
| Fibonacci Retracement | Identify potential reversal levels | Objective levels, widely followed | Requires swing points, less reliable in strong trends |
| Moving Averages | Dynamic support/resistance | Objective, dynamic, follows price | Lagging indicator, slower to react |
| Bollinger Bands | Volatility measurement | Objective, statistical | Less precise for trend identification |
📌 The pitchfork works best when combined with other tools. No single tool should be used in isolation.
8. Common Mistakes to Avoid
Even experienced traders make mistakes when using the Andrews Pitchfork. Here are the most common pitfalls and how to avoid them.
- Using the Wrong Pivot Points: Choosing insignificant swings will render the tool useless. Always select clear, significant swing highs and lows.
- Forcing the Pitchfork: If the pitchfork doesn’t fit naturally on the chart, the market may not be suitable for this analysis. Don’t force it.
- Ignoring the 80% Rule: The median line is the most important level — it should be your primary focus. Don’t overemphasise the outer lines.
- Using the Wrong Variant: Different market conditions require different variants. Use Original for strong trends, Schiff for volatile markets, and Modified Schiff for choppy markets.
- Not Waiting for Confirmation: Always wait for price action confirmation at pitchfork lines before entering trades.
- Ignoring Higher Timeframes: Always check higher timeframes to confirm the validity of your pitchfork.
9. Frequently Asked Questions
What is an Andrews pitchfork in trading?
An Andrews pitchfork is a technical analysis tool developed by Dr. Alan Andrews that uses three parallel lines — a median line with upper and lower lines — to identify trend channels, support and resistance levels, and potential price targets.
How does the Andrews pitchfork work?
The pitchfork works on the principle that price tends to return to the median line roughly 80% of the time. The upper and lower lines act as support and resistance, and when price fails to reach the median, it may signal a reversal.
How do you draw an Andrews pitchfork?
To draw a pitchfork, identify three pivot points: Point A (start of trend), Point B (first counter-trend swing), and Point C (second swing same direction as A). The median line connects Point A to the midpoint between B and C, with parallel lines drawn through B and C.
What are the different types of pitchforks?
The main variants are: Original (Andrews) — anchor stays at Point A; Schiff — anchor shifts 50% toward B in price only; and Modified Schiff — anchor shifts 50% toward B in both time and price. Each is suited to different market conditions.
What is the median line in pitchfork trading?
The median line is the central line of the pitchfork that follows the broad trend. Price tends to gravitate toward this line, and traders often look for bounces or reversals when price reaches it.
What is the best timeframe for pitchfork analysis?
Higher timeframes (daily, 4-hour) provide more reliable pitchfork signals. Lower timeframes produce more signals but with lower reliability. Swing traders typically use 4-hour and daily charts.
How do you trade with a pitchfork?
Common strategies include: buying at the median line (bounce), selling at the upper line (resistance), buying at the lower line (support), and trading breakouts when price exits the channel.
What happens when price fails to reach the median line?
When price fails to reach the median line, it may indicate that the trend is accelerating or that a reversal is developing. This can be a signal to adjust your trading strategy.
Can pitchfork analysis be used in all markets?
Yes, Andrews pitchfork can be applied to any market — forex, stocks, commodities, and cryptocurrencies. It is particularly effective in trending markets.
What is the difference between Andrews pitchfork and Schiff pitchfork?
The Schiff pitchfork is a variant of the Andrews pitchfork with an adjusted anchor position — it shifts 50% toward Point B in price (Y-axis only). It was developed by Jerome Schiff, a student of Andrews.
🤖 Automate Your Pitchfork Strategy: For traders looking to implement systematic trading strategies, browse our complete collection of forex trading robots and Expert Advisors — fully automated systems designed to execute a variety of strategies, including trend following and channel trading. Our robots trade 24/7, eliminate emotional decision-making, and have been tested across multiple market conditions, making them ideal for traders who want to combine pitchfork analysis with automated execution.
📈 Master Complementary Patterns: Enhance your pitchfork trading with our comprehensive guide to trading the inverted hammer candlestick pattern — a powerful bullish reversal signal that often appears at key pitchfork support levels. Learn how to identify this pattern and combine it with your pitchfork analysis for higher-probability entries at the lower parallel line or the median line.


 Signal2forex.com - Best Forex robots and signals


