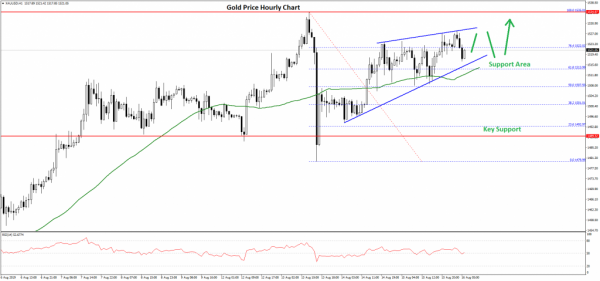
Gold price is trading in a strong uptrend above the $1,500 support area. Crude oil price is also likely to gain bullish momentum once it clears the key $55.50 resistance area.
Important Takeaways for Gold and Oil
- Gold price found support near the $1,490 level and is currently climbing higher against the US Dollar.
- There is major contracting triangle forming with resistance near $1,530 on the hourly chart of gold.
- Crude oil price is trading above the key $54.00 and $54.20 support levels.
- There was a break above a major bearish trend line with resistance near $54.60 on the hourly chart of XTI/USD.
Gold Price Technical Analysis
Earlier this week, gold price surged above the $1,500 and $1,510 resistance levels against the US Dollar. The price even broke the $1,520 resistance level and traded to a new yearly high at $1,535.
Recently, it corrected lower below $1,520 and $1,510. Moreover, there was a break below the $1,500 support and the 50 hourly simple moving average. A swing low was formed near $1,479 on FXOpen and the price started a fresh increase.

It recovered above the $1,500 level, the 50 hourly simple moving average, and the 50% Fib retracement level of the last drop from the $1,535 high to $1,479 low. The price is now trading nicely above the $1,500 level.
Moreover, there is a major contracting triangle forming with resistance near $1,530 on the hourly chart of gold. It seems like the price might continue to rise towards the $1,530 and $1,535 resistance levels.
If there are more upsides, the price could even trade past the $1,540 resistance level. On the downside, there is a strong support forming near the $1,512 level and the 50 hourly SMA.
If there is a downside break below the $1,512 support area, the price could start a fresh downward move towards the $1,480 support area.
Oil Price Technical Analysis
There was a slow and steady rise in crude oil price above the $54.00 resistance area against the US Dollar. The price traded as high as $57.36 and recently corrected below the $56.00 support.
The price even broke the $55.00 support and the 50 hourly simple moving average. A swing low was formed near $53.76 and the price is currently correcting higher.

It traded above the $54.50 level plus the 23.6% Fib retracement level of the last slide from the $57.36 high to $53.76 low. Moreover, there was a break above a major bearish trend line with resistance near $54.60 on the hourly chart of XTI/USD.
However, the price is facing a strong resistance near the $55.50 level and the 50 hourly SMA. The Fib retracement level of the last slide from the $57.36 high to $53.76 low is also near the $55.55 level.
Therefore, an upside break above the $55.50 and $55.55 resistance levels might start a solid rise. The next key resistance is near the $56.00 level, above which the price could climb towards the last swing high near $57.36.
On the downside, an immediate support is near the $54.40 level and a bullish trend line on the hourly chart. If there is a downside break below $54.40 and $54.20, the price could decline towards the $52.00 support area in the near term.
Recommend professional Forex robots


 Signal2forex.com - Best Forex robots and signals


