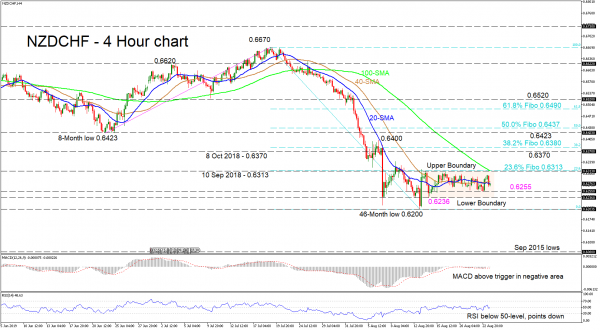
NZDCHF bulls denied further downside momentum on August 13 pushing the price back up to 0.6313, which is the 23.6% Fibonacci retracement level of the down wave from 0.6670 to 0.6200, and into a short-term trading range.
The 20- and 40-period simple moving averages (SMAs) give no clear direction on the four-hour chart, whilst the 100-period SMA reflects the bigger bearish picture. Directional momentum has evaporated, with the MACD only slightly above its red trigger line and just below the zero level. The RSI has also marginally declined below the neutral level.
In a negative scenario, the price could find initial support at 0.6255 before testing the lower boundary of the short-term trading range at 0.6236. A move lower could see a revisit of the forty-six-month low of 0.6200, which is also a psychological level. If the bears dominate, focus could shift to the September 2015 lows at 0.6080.
To the upside, if the bulls manage to surpass the 0.6313 resistance barrier, where the 23.6% Fibo and 100-period SMA are located, this could reel in the 0.6370 resistance level from back in October 2018. Climbing higher the inside swing low of 0.6423 could unfold if the resistance area of 0.6380 – 0.6400 is breached, the former being the 23.6% Fibo level.
In a nutshell, the pair is waiting for a directional break either above 0.6313 or below 0.6236 in the very short-term.
Recommend professional Forex robots
 Signal2forex.com - Best Forex robots and signals


