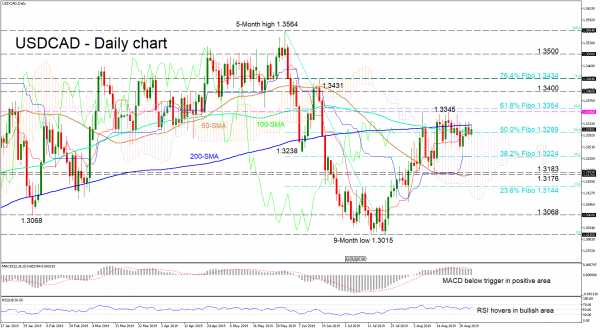
USDCAD has been unable to overcome the 1.3345 barrier, despite breaching the 200-day simple moving average (SMA). The 1.3345 resistance is showing resilience as it was tested multiple times over the last two-weeks of consolidation. The price is slightly above the Ichimoku cloud between the 100- and 200-day SMAs increasing the odds that the sideways move may outstretch a while longer.
Regarding momentum, the MACD is in positive territory and has moved below its red trigger line, reflecting weakening upside momentum. The RSI hovers in the bullish area, while the Ichimoku indicators are flat, also backing a short-term neutral market that may endure.
If the 200-day SMA holds and the price retraces back into the cloud, first in line could be 1.3224, which is the 38.2% Fibonacci retracement level of the down leg from 1.3564 to 1.3015. Lower inside the cloud, a more durable support region of 1.3183 -1.3176, where the swing lows and the 50-day SMA are found, could stall the decline. If the bears pick up and manage to penetrate below the 1.3144 level, which is the 23.6% Fibo, the loonie could home in on the 9-month low of 1.3015, finding some friction on the way down from the 1.3068 supports.
Moving above the 200-day SMA, if the bulls retest the 1.3345 resistance level and manage also to push above the slightly higher 61.8% Fibo of 1.3354, the road could open to test the 1.3400 handle ahead of the 76.4% Fibo of 1.3434. If another rally unfolds above the swing high of 1.3434, the 1.3500 resistance could be tested before a revisit of the five-month high of 1.3564.
Overall, if the pair closes above 1.3345, the short-term outlook would turn neutral-to-bullish. Furthermore, a close above the 1.3434 level would turn the medium-term to neutral.
Recommend professional Forex robots
 Signal2forex.com - Best Forex robots and signals


