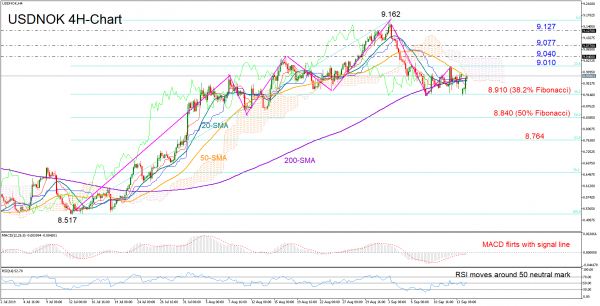
USDNOK has created a lower low around 8.910 and a lower high at 9.010, putting its upward pattern that topped at a multi-year high of 9.162 into speculation.
The 50-period simple moving average (SMA) in the four-hour chart is heading for a bearish cross with the 200-period SMA, signaling that a resumption of the positive trend may be difficult to be achieved. Meanwhile, in momentum indicators, the RSI and the MACD suggest that the next move in the price may be neutral-to-bearish as the former holds around its 50 neutral level and the latter fluctuates around its red signal line.
The 38.2% Fibonacci of 8.910 of the bullish wave from 8.517 to 9.162 has successfully deterred steeper downside corrections this month and therefore should be closely watched if selling pressures return. In case it fails to hold this time, traders could search for support around the 50% Fibonacci of 8.840, where any break lower would confirm the start of a downtrend if forcefully breached. Then the focus could shift to the 61.8% Fibonacci of 8.764.
On the other hand, a decisive rally above the 50-period SMA and more importantly a closing price above the 23.6% Fibonacci of 9.010, which halted upside movements last week, could restore some buying interest. Subsequently, the pair could potentially catch the upper surface of the Ichimoku cloud seen around the August 16 high of 9.041, while a retest of the 9.077-9.127 area cannot be ruled out either.
In brief, USDNOK’s upswing seems to be losing steam, though traders should wait for a sharp decline under 8.910 in order to reduce long exposure on the pair.

Recommend professional Forex robots


 Signal2forex.com - Best Forex robots and signals


