
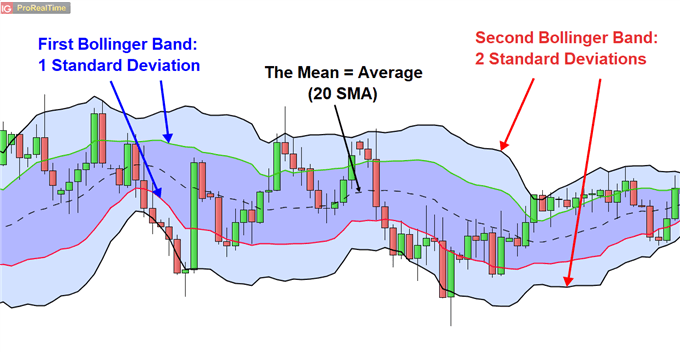
The Double Bollinger Band (DBB) strategy is a forex volatility system that overlays two Bollinger Bands — (20, 2) and (20, 1) — to split a currency chart into three tradable zones: Buy, Neutral and Sell. Below: MT4/MT5 settings, breakout & trend rules with EUR/USD, GBP/USD and USD/JPY examples, central-bank case studies (Fed, ECB, BoE, BoJ 2024–2026), comparison tables and a pre-trade checklist.
⚡ Quick Answer — What Is the Double Bollinger Band Strategy?
The Double Bollinger Band (DBB) strategy overlays two Bollinger Bands — (20, 2) and (20, 1) — on one forex chart, creating three zones: Buy Zone (+1σ to +2σ), Neutral Zone (−1σ to +1σ) and Sell Zone (−1σ to −2σ). Traders go long in the Buy Zone, short in the Sell Zone, and stand aside in the Neutral Zone; stop-losses sit at the 20 SMA with a minimum 1:2 reward-to-risk.
Double Bollinger Bands (DBB)
/ˈdʌb.əl ˈbɒl.ɪn.dʒər bændz/ · US /ˈbɑː.lɪn.dʒɚ/ noun · technical analysisSynonyms: DBB · Dual Bollinger Bands · Double BB · Bollinger Zone Map (Kathy Lien’s “DBB”)
Quick definition: a volatility overlay combining two Bollinger Bands with a shared 20-period SMA but different deviations (2 and 1), dividing a forex chart into Buy, Neutral and Sell zones for momentum and breakout trading.
Example 1: “EUR/USD closed inside the upper Double Bollinger Band Buy Zone for six consecutive H1 candles, confirming bullish momentum ahead of the ECB decision.”
Example 2: “When USD/JPY slipped from the Sell Zone into the Neutral Zone after the BoJ hike, we trailed our stop to the 20 SMA.”
1. What Is the Double Bollinger Band Strategy in Forex?
The Double Bollinger Band (DBB) strategy places two Bollinger Band indicators — (20, 2) and (20, 1) — on the same currency pair chart. Because roughly 95% of closes fall inside ±2σ and ~68% inside ±1σ of the 20 SMA (the empirical rule behind John Bollinger’s original construction, bollingerbands.com), the two overlays carve the chart into three statistically meaningful zones. The approach was popularised for FX by Kathy Lien in Day Trading and Swing Trading the Currency Market and is now a standard momentum filter on EUR/USD, GBP/USD and USD/JPY.
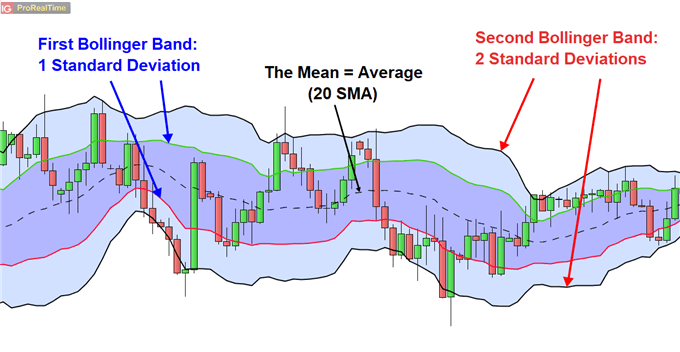
Fig 1: DBB on a forex chart — three zones (Buy, Neutral, Sell) built from (20,2) and (20,1) bands.
2. How DBB Works on Currency Pairs
The 20-period SMA is the “fair value” of the pair. The 1σ band marks moderate volatility, the 2σ band extreme volatility. Closes riding the upper 1σ–2σ corridor mean buyers control the session (typical of EUR/USD trend days after an ECB surprise); the lower corridor means sellers dominate (USD/JPY during BoJ tightening); the inner corridor is two-way noise where spreads and whipsaws eat edge.
- Trend strength: consecutive closes in the Buy/Sell Zone = momentum confirmation.
- Volatility expansion: bands widening = breakout energy (news-driven FX moves).
- Consolidation: price stuck in the Neutral Zone = stand aside.
- Overextension: tags of the 2σ band = take-profit area, not automatic reversal.
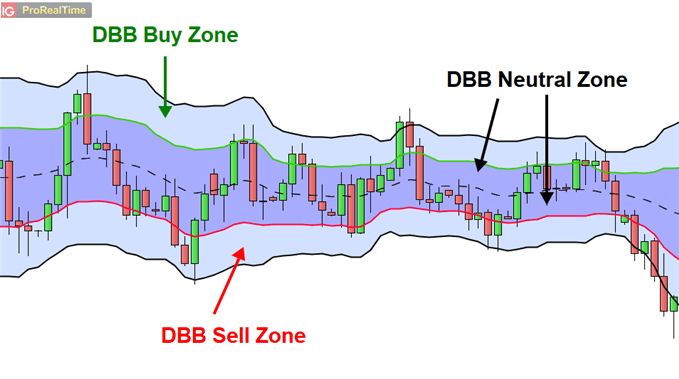
Fig 2: The two overlays and their standard-deviation levels on a live pair.
Fig 3 (schematic): zone map — price cycling Neutral → Buy → Neutral → Sell on a currency pair.
3. MT4/MT5 Setup — Double Bollinger Band Settings
- Open the pair chart (e.g., EUR/USD H1) in MT4/MT5.
- First band: Insert → Indicators → Trend → Bollinger Bands → Period 20, Deviation 2.0, apply to Close, colour blue.
- Second band: repeat with Period 20, Deviation 1.0, colour red.
- Verify: one shared 20 SMA, outer (2σ) and inner (1σ) envelopes visible.
| Parameter | Band 1 (outer) | Band 2 (inner) | Why it matters for FX |
|---|---|---|---|
| Period | 20 | 20 | One month of trading sessions — the standard Bollinger look-back |
| Deviation | 2.0 | 1.0 | ≈95% / ≈68% of closes inside — defines the zone edges |
| Apply to | Close | Close | Consistent fair-value baseline |
| Colour | Blue | Red | Instant visual zone reading during London/NY overlap |
4. The Three Trading Zones — Buy, Neutral, Sell
| Zone | Location | Signal on a currency pair | Action |
|---|---|---|---|
| Buy Zone | +1σ … +2σ above 20 SMA | Bullish momentum (e.g., EUR/USD post-dovish Fed) | Look for longs |
| Neutral Zone | −1σ … +1σ | Two-way noise / range | No new positions |
| Sell Zone | −1σ … −2σ below 20 SMA | Bearish momentum (e.g., USD/JPY post-BoJ hike) | Look for shorts |
5. DBB Breakout Strategy (Forex Pairs)

Fig 4: EUR/GBP breakout — Neutral Zone squeeze → Buy Zone entry, SL at 20 SMA, TP at swing high.
- Identify a Neutral Zone squeeze (bands contracting — low volatility, often Asian session).
- Wait for a strong candle close beyond ±1σ into the Buy or Sell Zone (London/NY open).
- Confirm band expansion (volatility injection).
- Enter on the close; stop at the 20 SMA; target the nearest swing high/low; ≥ 1:2 R:R.
| Element | Rule |
|---|---|
| Entry | Candle close inside Buy/Sell Zone + expanding bands |
| Stop-Loss | 20 SMA |
| Take-Profit | Previous swing high/low or 2σ tag |
| Risk/Reward | Minimum 1:2 |
6. DBB Trend Trading Strategy
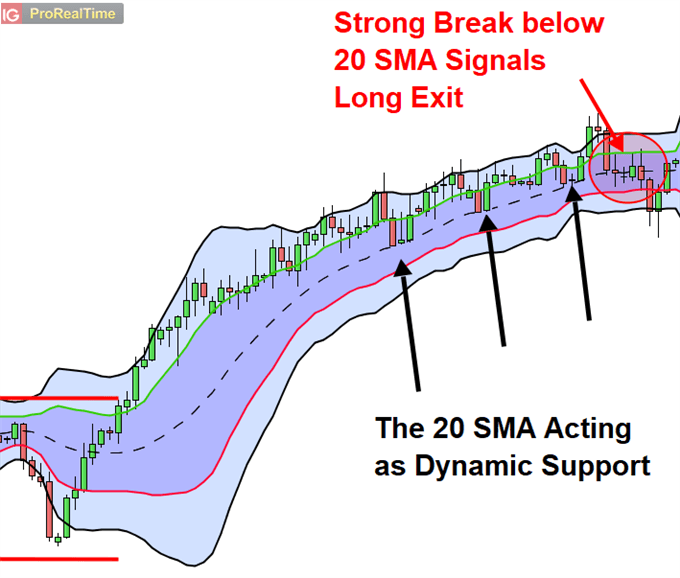
Fig 5: trend mode — price riding the Buy Zone, pyramiding on 1σ pullbacks.
- Uptrend: closes stack in the Buy Zone; add on pullbacks to +1σ.
- Downtrend: closes stack in the Sell Zone; add on rallies to −1σ.
- Exit: first candle close back inside the Neutral Zone.
- Trail: stop at the 20 SMA, never at the band edge.
7. Central Bank Decisions & DBB Signals (Fed, ECB, BoE, BoJ 2024–2026)
DBB zones are volatility-driven, and the biggest FX volatility injections of 2024–2026 came from central-bank decision weeks. Rate differentials reprice currency pairs for weeks, which is exactly the environment where zone-riding works.
- ECB, 6 June 2024: first cut of the cycle, deposit rate 4.00% → 3.75%, opening an easing path that reached 2.00% by June 2025 (ECB key interest rates). Each decision week printed clean Sell/Buy-zone rotations on EUR/USD.
- Fed, 18 September 2024: 50 bp cut to a 4.75–5.00% target range after holding 5.25–5.50% (Federal Reserve monetary policy). EUR/USD printed the widest H4 band expansion of Q3-2024 and nine consecutive closes in the Buy Zone.
- BoJ, March 2024 / January 2025: end of negative rates, then a hike to 0.50% (Bank of Japan). USD/JPY trended in the DBB Sell Zone for weeks after each step.
- BoE, August 2024: first cut 5.25% → 5.00% (Bank of England) — GBP/USD swept all three DBB zones within two sessions.
Fig 6 (schematic): central-bank decision markers and the DBB trends they triggered on major pairs.
8. DBB vs Other Volatility Tools — Comparison Table
| Tool | Construction | Signal style | Best FX condition | Main weakness |
|---|---|---|---|---|
| Double Bollinger Bands (20,2 + 20,1) | 2 BB overlays, shared 20 SMA | 3 zones: Buy / Neutral / Sell | Trends + post-squeeze breakouts | Whipsaws in tight ranges |
| Single BB (20,2) | 1 overlay | Overbought/oversold vs mean | Mean-reversion ranges | No neutral-zone filter |
| Keltner Channels (20, 1.5×ATR) | EMA + ATR | Squeeze/breakout | Volatility expansion | No statistical zone map |
| Donchian (20/55) | Swing highs/lows | Trend channel | Long-term trends | Very late entries |
9. Advantages & Limitations
Advantages ✅
- Squeeze (low volatility) objectively flags upcoming expansion — ideal before London open.
- Three zones give mechanical entry/exit levels for pairs trading.
- Momentum reading is instant: zone = trend health.
- Works M5→Monthly; most reliable H1+.
- One toolset serves both breakout and trend playbooks.
Limitations ❌
- Extreme 2σ tags can reverse sharply against position.
- Requires disciplined 20-SMA stops.
- Weak in choppy, news-less ranges (e.g., holiday weeks).
- False breakouts when band width is minimal.
- Beginners must master single Bollinger Bands first.
10. Reference Tables & Trading Checklist
Key Terms
Recommended Settings by Timeframe
| Timeframe | Period / Deviations | Use case |
|---|---|---|
| M5–M15 | 20 · 2.0 & 1.0 | Scalping — tightest risk control |
| H1 | 20 · 2.0 & 1.0 | Intraday / swing standard |
| H4 | 20 · 2.0 & 1.0 | Swing — central-bank trends |
| D1 | 20 · 2.0 & 1.0 | Position trading rate cycles |
Pre-Trade Checklist
11. Frequently Asked Questions (FAQ)
What are double Bollinger Bands in forex?
Double Bollinger Bands (DBB) overlay two Bollinger Band indicators — (20, 2) and (20, 1) — on the same currency chart, splitting price action into three zones: Buy (+1σ to +2σ), Neutral (−1σ to +1σ) and Sell (−1σ to −2σ).
What are the best Double Bollinger Band settings?
The standard settings are a 20-period SMA with deviations 2.0 and 1.0 on both bands. They work on all forex timeframes; 1H and 4H produce the most reliable signals, while 5M–15M require stricter risk control.
How do you set up double Bollinger Bands on MT4/MT5?
Insert two Bollinger Bands indicators: first with Period 20, Deviation 2, second with Period 20, Deviation 1, both applied to Close. Use different colours so the Buy, Neutral and Sell zones are visually distinct.
How do you trade the DBB breakout strategy on currency pairs?
Wait for consolidation inside the Neutral Zone, then enter on a strong candle closing into the Buy or Sell Zone while the bands expand. Place the stop-loss at the 20 SMA and target the nearest swing high/low with at least 1:2 reward-to-risk.
How do you trade the DBB trend strategy?
In an established trend, price rides the Buy or Sell Zone. Add to winners while momentum holds, trail the stop to the 20 SMA, and exit when a candle closes back inside the Neutral Zone.
What are the three DBB zones?
Buy Zone between +1σ and +2σ (bullish momentum), Neutral Zone between −1σ and +1σ (no edge), Sell Zone between −1σ and −2σ (bearish momentum).
How do Fed and ECB decisions affect DBB signals?
Rate decisions and press conferences (Fed, ECB, BoE, BoJ) trigger volatility expansion, which widens the bands and pushes price into the Buy or Sell Zone — producing the strongest DBB breakout signals. Avoid entering new positions in the minutes around high-impact central-bank news.
Which forex pairs and timeframes work best with DBB?
DBB works on any liquid pair (EUR/USD, GBP/USD, USD/JPY). Higher timeframes (1H, 4H, Daily) give cleaner zone reads; lower timeframes suit scalping with tighter risk.
What are the limitations of double Bollinger Bands?
In choppy ranges DBB produces false breakouts, and price can hug the 2σ band longer than expected in strong trends. Always combine zones with candle confirmation, central-bank context and a 1:2+ reward-to-risk rule.
12. Conclusion
The Double Bollinger Band strategy turns one indicator into a complete forex decision framework: zones for direction, band width for volatility, the 20 SMA for risk. Master the two playbooks — breakout after Neutral-Zone squeezes and trend-riding during central-bank cycles — and enforce the 1:2 rule on every trade.
Primary Sources & Data
- Bollinger, J. — Bollinger Bands originator documentation: bollingerbands.com
- Federal Reserve — Monetary Policy: federalreserve.gov
- ECB — Key Interest Rates: ecb.europa.eu
- Bank of England: bankofengland.co.uk · Bank of Japan: boj.or.jp
- Lien, K. — Day Trading and Swing Trading the Currency Market (DBB zone concept for FX).



 Signal2forex.com - Best Forex robots and signals


