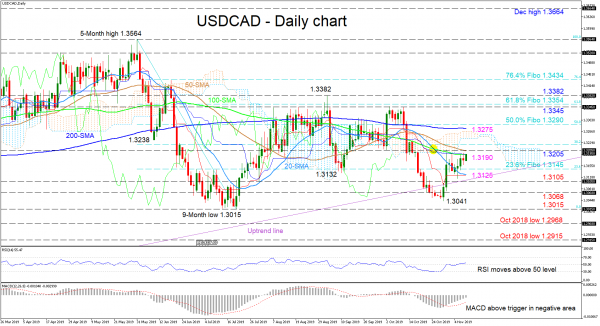
USDCAD has been restricted by the 100-day simple moving average (SMA) in recent sessions, after buyers aggressively reversed the pair back above the uptrend line, reestablishing a neutral-to-bullish picture.
Despite the bearish demeanor of the 20- and 50-day SMAs, the 200- and 100-day SMAs as well as the Tenkan-sen and Kijun-sen lines reflect a stall in momentum, which could have the price endure a sideways move towards the trendline. The MACD has risen above its red trigger line and nears the zero mark, while the RSI, inclines slightly above the 50 level, both backing an improving view.
If buyers manage to break above the 100-day SMA currently at 1.3190 and the nearby 50-day SMA that lies at the 1.3205 resistance, the price could jump to test the 200-day SMA at 1.3275. Slightly higher, the 1.3290 level, which is the 50.0% Fibonacci retracement of the down leg from 1.3564 to 1.3015, could hinder the climb to the congested resistance region of 1.3345 to 1.3382, consisting of peaks from August to October and the 61.8% Fibo.
If selling interest picks up, the 23.6% Fibo of 1.3145 could initially limit declines ahead of the 20-day SMA and uptrend line around 1.3125. Below the uptrend line, the 1.3105 and 1.3068 support levels could challenge the bears, while the 1.3041 swing low would have to give way for sellers to test the nine-month trough of 1.3015.
In brief, the short-term bias looks neutral-to-bullish. Yet, a break above 1.3382 would clearly turn the bias to bullish, while a break below 1.3015 would strengthen the negative outlook.


 Signal2forex.com - Best Forex robots and signals


 Afrikaans
 Albanian
 Arabic
 Armenian
 Azerbaijani
 Bengali
 Bosnian
 Bulgarian
 Chinese (Traditional)
 Croatian
 Czech
Czech Danish
 Dutch
Dutch Estonian
 Filipino
 Finnish
 French
 Georgian
 German
 Greek
Greek Hebrew
 Hindi
Hindi Hungarian
 Indonesian
 Italian
 Japanese
 Kannada
 Korean
 Kyrgyz
 Latvian
 Lithuanian
 Malay
Malay Norwegian
 Persian
 Polish
 Portuguese
 Romanian
 Russian
 Serbian
 Slovak
 Slovenian
 Spanish
 Swahili
 Swedish
 Thai
Thai Turkish
 Ukrainian
 Uzbek
Uzbek Vietnamese