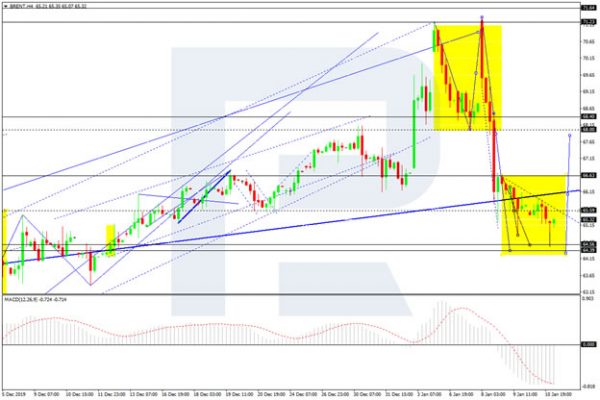
On Monday, January 13th, Oil prices stopped falling right now, the instrument is consolidating around 65.05 USD.
The latest report on the number of oil rigs in the USA from Baker Hughes showed -11 units, thus bringing the total number to 659. The indicator has been decreasing for the third consecutive period. The number of gas rigs dropped by 4 units, down to 119 totals. Overall, the number of rigs lost 15 units over the previous week and now equals to 781. Let’s remember that a year ago the indicator was 1,075 units.
It’s a pretty bullish signal for commodity market investors, but their attention is mostly focused on speculations.
For example, the US-Iranian conflict is fading a bit but still remains open. This Middle Eastern issue may catch fire in split seconds and market players will buy oil from the current levels with great pleasure only for selling it when it reaches 70.00 USD.
As we can see in the H4 chart, Brent has broken 68.00 to the upside and may correct to reach 64.40. Possibly, today the pair may finish this descending wave and form a new one to the upside with the target at 65.00. After that, the instrument may start another correction towards 66.00 and then resume growing to reach 71.25. From the technical point of view, this scenario is confirmed by MACD Oscillator: its signal line is moving upwards above 0 and may leave the histogram area soon. This, in its turn, means that the pair is about to complete its descending tendency, which may be followed by another wave inside the uptrend.
In the H1 chart, after breaking 65.20 to the downside, Brent may continue falling to reach 64.60. Today, the pair may reach this level and form one more ascending wave. If later the price breaks 65.85 upwards, the instrument may continue growing to reach the first target at 68.00. From the technical point of view, this scenario is confirmed by Stochastic Oscillator: its signal line is moving below 50, thus indicating that the pair may update the low and then resume the uptrend.


 Signal2forex.com - Best Forex robots and signals


