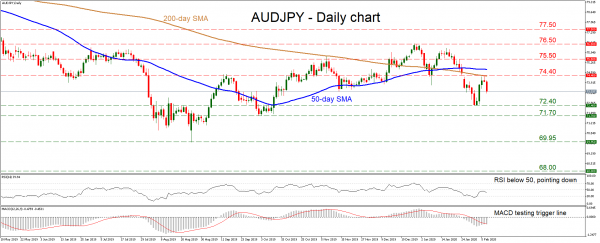
AUDJPY posted a ‘golden cross’ in mid-January – which is usually a positive sign – but was unable to sustain the upside momentum. Instead, the price structure on the daily chart seems to be turning negative, with lower highs and lower lows below both the 50- and 200-day simple moving averages (SMAs). A dive back below 72.40 would confirm that the outlook has turned bearish.
Short-term momentum oscillators endorse an increasingly negative picture, with the RSI turning down after testing its 50 line, while the MACD – already negative – is struggling to cross above its red trigger line.
Should the bears stay in charge and post a new low beneath 72.40, their next target might be the October low of 71.70. If that fails to hold too, support may be found near the 10-year low of 69.95, where another downside violation would turn the focus to 68.00, a level defined by the April 20, 2009 low.
On the flipside, if buyers retake the reins, the first stop may be the 74.40 hurdle that also encompasses the 200-day SMA. If they pierce above that zone, and also manage to overcome the 50-day SMA at 74.80, then the focus would turn to 75.50 next.
Summarizing, a move below 72.40 would reaffirm that the pair is in a downtrend.


 Signal2forex.com - Best Forex robots and signals


