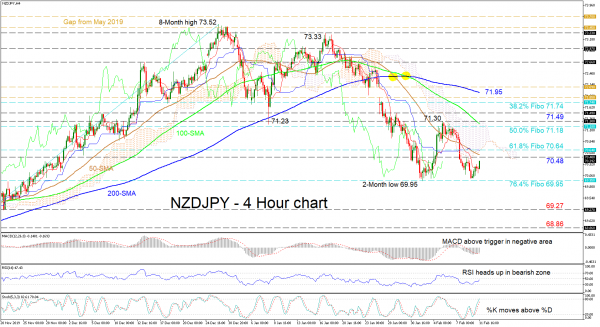
NZDJPY yesterday hit a floor at the 70.00 mark, resulting in the pair’s second reversal around the 70.00 – 69.95 barrier (previous resistance-now-support levels), which held back in October and November of 2019. The improving short-term oscillators back the recent push up in the pair, which has already moved over the red Tenkan-sen line.
The MACD and the RSI are increasing in bearish territories, with the MACD rising above its red trigger line, and the Stochastic %K and %D lines reaching just short of the 80 level. Moreover, the flat Kijun-sen could be warning of a possible shift in the trend to the upside. That said, significant backing from buyers would need to emerge to overpower the prevailing neutral-to-bearish picture reflected in all the downward sloping simple moving averages (SMAs).
If buying interest continues, initially the move up would need to push past the area from the high of 70.48 to the 70.64 level, this being the 61.8% Fibonacci retracement of the up leg from 68.86 to 73.52 – which also encapsulates the 50-period SMA. Driving higher, the region from the 50.0% Fibo of 71.18 until the 71.30 swing high – which also captures the 100-period SMA and upper band of the cloud – may prove hard to conquer. Clearing these, the 71.49 resistance may hinder the climb from testing the 38.2% Fibo of 71.74 and the 200-period SMA at 71.95.
If sellers resurface and steer below the tough obstacle of 69.95, which happens to also be the 76.4% Fibo, the pair could dive towards the 69.27 trough ahead of the 68.86 low.
Overall, a sustained effort from buyers would be required to turn the near-term bearish outlook positive.
 Signal2forex.com - Best Forex robots and signals


