Key Highlights
- USD/JPY rallied recently above the 111.00 and 112.00 resistance levels.
- A crucial bearish trend line was breached at 110.05 on the weekly chart.
- The US Initial Jobless Claims for the week ending Feb 15, 2020 increased from 206K to 210K.
- The US Manufacturing PMI could decline from 51.9 to 51.5 in Feb 2020 (Preliminary).
USD/JPY Technical Analysis
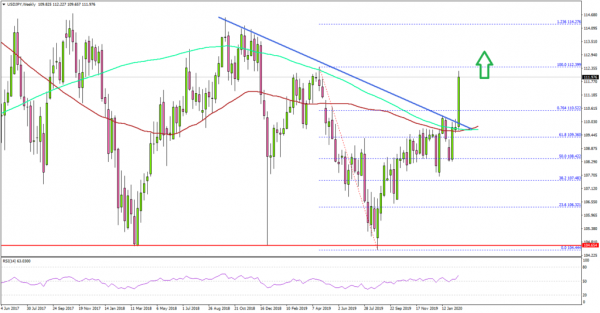
This month, the US Dollar formed a strong support base above 109.50 against the Japanese Yen. As a result, USD/JPY saw a significant bullish break and a strong upward move above the 110.50 resistance area.
Looking at the weekly chart, the pair settled nicely above the 110.00 area, the 100-week simple moving average (red), and the 200-week simple moving average (green).
More importantly, there was a break above a crucial bearish trend line with resistance at 110.05 on the same chart. The pair even surged above the 76.4% Fib retracement level of the downward move from the 112.39 high (formed on 2019.04.21) to 104.44 low (formed on 2019.08.25).
The pair is now surging and it is trading nicely above many hurdles. It seems like it could continue to rise towards the 113.50 and 114.00 levels.
The main target for buyers could be 114.27 since it represents the 1.236 Fib extension level of the downward move from the 112.39 high to 104.44 low.
If there is a downside correction, the pair might find support near the 111.50 level. The main uptrend support is now forming near 110.00 and the 100-week simple moving average (red).
Fundamentally, the US Initial Jobless Claims figure for the week ending Feb 15, 2020 was released by the US Department of Labor. The market was looking for an increase in claims from 205K to 210K.
However, the result was in line with the forecast, as the US Initial Jobless Claims increased to 210K. Besides, the last reading was revised up from 205K to 206K.
The report added:
The 4-week moving average was 209,000, a decrease of 3,250 from the previous week’s revised average. The previous week’s average was revised up by 250 from 212,000 to 212,250.
Overall, USD/JPY clearly started a strong uptrend on the weekly chart and it could continue higher towards 114.00. Conversely, EUR/USD and GBP/USD faced renewed downtrend pressure in the past few sessions.
Upcoming Economic Releases
- Germany’s Manufacturing PMI for Feb 2020 (Preliminary) – Forecast 44.8, versus 45.3 previous.
- Germany’s Services PMI for Feb 2020 (Preliminary) – Forecast 53.8, versus 54.2 previous.
- Euro Zone Manufacturing PMI Feb 2020 (Preliminary) – Forecast 47.5, versus 47.9 previous.
- Euro Zone Services PMI for Feb 2020 (Preliminary) – Forecast 52.2, versus 52.5 previous.
- Euro Zone CPI for Jan 2020 (YoY) – Forecast +1.4%, versus +1.4% previous.
- Euro Zone CPI for Jan 2020 (MoM) – Forecast -1.0%, versus +0.3% previous.
- UK Manufacturing PMI for Feb 2020 (Preliminary) – Forecast 49.7, versus 50.0 previous.
- UK Services PMI for Feb 2020 (Preliminary) – Forecast 53.4, versus 53.9 previous.
- US Manufacturing PMI for Feb 2020 (Preliminary) – Forecast 51.5, versus 51.9 previous.
- US Services PMI for Feb 2020 (Preliminary) – Forecast 53.0, versus 53.4 previous.
 Signal2forex.com - Best Forex robots and signals


