Highlights
- The Phase One trade deal marks a détente in the U.S.-China trade war, rolling back tariff rates, reducing the risk of further tariff escalation and alleviating a major source of policy uncertainty.
- A key part of the deal is China’s commitment to raise its purchases of selected U.S. goods and services by $200 billion over the next two years.
- Achieving the target will be difficult. For the U.S., a drastic increase in production will be challenging due to limited capacity. For China, meeting the lofty goal will likely require a range of strategies – substituting production with imports, diverting purchases from elsewhere, and stockpiling storable goods. The coronavirus (COVID-19) will amplify the challenges in meeting the deal’s targets.
- For the rest of the world, any positives the deal generates in terms of reducing global uncertainty could be offset by a loss in market share to the U.S.
- The Phase One deal will likely provide a modest boost to U.S. and Chinese economic growth, but it is only a first step. The deal does not address more contentious topics such as Chinese industrial subsidies. As a result, uncertainty around the U.S.-China trading relationship will remain.
The U.S.-China trade war, ongoing since 2018, came to a ceasefire on January 15, 2020 with the signing of a ‘Phase One’ agreement. The deal does not mark a full cessation of hostilities, as several issues remain unresolved. Even as the U.S. pulled back from the threat of future tariffs and has cut the rate on the most-recent round of tariffs in half (to 7.5% from 15%), others remain in place on over $350 billion in goods imported from China, roughly 65% of the total.
On the Chinese side, tariffs on $75 billion in imports from the U.S. have been cut in half (to 5% from 10% for certain goods and to 2.5% from 5.0% for others). Still, taxes remain in place on over half of the roughly $100 billion in goods purchased from the U.S.
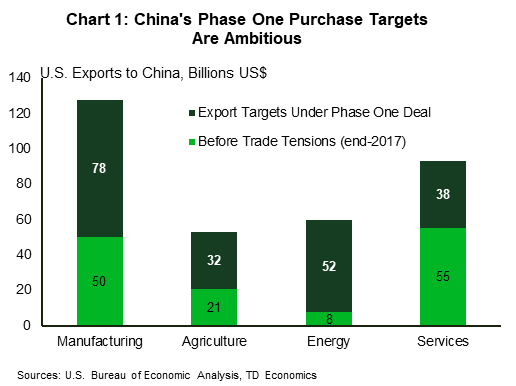
Nonetheless, a key part of the deal is a Chinese commitment to raise its imports of goods and services from the U.S. by $200 billion by the end of 2021. This is an ambitious commitment. If met, it would represent a doubling of U.S. exports to China in the agreed categories relative to a 2017 baseline (Chart 1).
The deal should be positive for the American economy in the near term, reducing policy uncertainty, while boosting exports and capacity utilization, and potentially lifting investment within the sectors covered by the deal.
Still, such a rapid increase in imports is unprecedented in an era of slowing Chinese economic growth. Achieving the target is likely to come at the expense of other countries, which may find that China substitutes their products in favor of U.S. sourced goods. For most large advanced economies, the exposure is mainly to manufactured goods, which represent bigger shares of economic activity relative to energy and agriculture.
The deal represents a move from free trade to managed trade. It follows a significant degree of trade diversion already evident in the data due to tariffs enacted over the past two years. The trade deal may reverse some of this, but it is unlikely to mark a return to more integrated rules-based global trade. The move away from a market-based system of resource allocation and the principle of comparative advantage risks undermining efficiency, creating negative externalities, and ultimately slowing potential economic growth.
China pledges to buy (a lot more) American
China’s commitment to raise purchases of U.S. goods and services by $200 billion are spread between agriculture, manufacturing, energy and services.1 There are specific intermediate targets for increases in 2020 and 2021 relative to the 2017 baseline (Table 1).
The targets set under the deal are formidable, especially those for the energy sector. The commitment to energy represents an eight-fold increase relative to 2017 levels. The targets for manufacturing and agriculture are also ambitious, representing a three-time increase relative to 2017.
Outside of China’s pledge of $200 billion in additional purchases, the U.S. also won commitments to reduce non-tariff barriers to agricultural trade, better protect U.S. intellectual property, and open its financial system to American and global companies. On many of these items, China was moving in this direction already, but the deal codifies its commitments and gives the U.S. some recourse if it believes they are not being met in a timely fashion.2
A difficult starting point even before the COVID-19 outbreak
Due to the escalating tariff war that started in 2018, trade flows between the two countries in the covered products look substantially different from pre-tariff trade flows in 2017. For example, imports of agricultural goods covered in the deal were $24 billion in 2017, but only $16 billion in 2018, implying an even bigger increase to hit the target. Additionally, U.S. and Chinese trade data are not consistent with each other, which may be a potential source of confusion over whether targets are being met.3
China is also going through a cyclical and structural growth slowdown. On the former, the COVID-19 outbreak has halted factory work, grounded flights, disrupted supply chains, and weighed on commodity markets. These developments are a major obstacle in the path to fulfilling purchase commitments. The virus and the efforts taken to contain it are likely to shave roughly a percentage point from our 2020 forecast for China. It has already reduced prices of key Chinese imports from the U.S., including cotton, hogs, and soybeans. Soybeans future prices – historically the most valuable U.S. export to China and part of the Phase One deal – have slumped almost 5% since the day before the deal due to COVID-19 fears. Since the targets are nominal values, this drop in price matters. The text of the deal allows for flexibility on the targets “in the event that a natural disaster or other unforeseeable event” takes place. As the crisis deepens it becomes increasingly likely that China will seek such flexibility, especially on the timeline.
To meet targets, U.S. exporting firms will require more capacity
Difficulty in meeting the targets, however, will not just be on the part of the Chinese. U.S. exports to China would have to grow by 18% annually from 2017 levels to hit the target. Indeed, the trade war over the last two years have made these targets even more difficult to meet. While data on the exact categories of covered goods are not yet available for 2019, overall U.S. goods exports to China fell by more than 10% last year. Exports of energy products plummeted by 50% over the course of the year, implying a much lower starting point and an even larger increase in purchases relative to current levels to hit targets (Chart 2).
The challenge for U.S. exporters will be how to allocate resources to meet the additional demand. Ten years into the economic expansion, the American economy is operating close to potential. The unemployment rate is at a fifty-year low and finding qualified workers is cited as the top concern among small and medium-sized businesses. Additional resources pulled into these sectors may worsen resource constraints in others.
That said, there is room to increase capacity utilization and thereby raise production within goods-producing sectors, but perhaps not as much as assumed by the agreed trade targets. Indeed, industrial capacity utilization hit a decade high in the final month of 2018, before the trade war and slowdown in global growth led to a decline in utilization over the course of 2019. Even so, as of December 2019, it was right in line with its 10-year average. An increase in goods exports to China should help to push capacity back toward its peak level, and thereby reverse some of the damage caused by the trade war, helping to lift overall economic growth.
Once capacity is absorbed, any additional production will require investment, but undertaking such investment requires some certainty that the purchases will indeed be made, and beyond that, that the global market will remain a source of growth.
Rather than increasing production, U.S. producers could simply divert exports from the rest of the world. U.S. exports to China in the products covered have consistently remained below 10% of its global exports over the past decade. While diverting exports would do little to support economic growth, it could make sense to do so if China offers above market prices to meet its commitments. This would provide an added income boost to American producers, but could lead to trade disputes with other partners.
The one area where targets appear relatively reasonable is in services (Chart 3). While comparable data on services across countries is hard to attain, the growth in services required to hit targets relative to recent trends seems achievable and may not require much in the way of additional disruption.
On that note, the deal does not cover all U.S. exports to China. Almost 30% of U.S. exports to China ($51.6 billion of American exports in 2017) are not covered by the deal. Working with a narrower set of products – 72% of U.S. exports to China – could offset some of the improvement in the U.S.-China trade deficit that the increased purchases are meant to remedy. As the increased purchases lower the deficit, the dollar will rise, making the unmanaged categories less competitive and counteracting the goal of the deal.
China has several options to meet targets
Despite the obvious headwinds, China is likely to use the following approaches to meet its targets:
1. Increase imports from the U.S., while decreasing imports from the rest of the world.
China has said that “purchases will be made at market prices based on commercial considerations” and that the increase in exports would not happen at the expense of other countries. It has also assured its trading partners that any increase in imports would adhere to World Trade Organization (WTO) requirements.
However, it would be difficult for China to meet these targets without diverting trade from other trading partners. This is especially true for manufacturing exports (Chart 3). However, manufacturing supply chains are complex and sticky, therefore, it will be difficult to actively disrupt them, at least in the near-term. On the other hand, it is easier to switch imports for energy and agriculture goods, which are relatively less sophisticated.
2. Increase U.S. imports at the expense of domestic production
China could create space for higher U.S. exports by cutting down on domestic production. However, this may turn out to be a pro-cyclical strategy and further push China’s growth slowdown, at least in the near-term. This could also have domestic political ramifications.
3. Increase U.S. imports by building inventories without sacrificing domestic production.
China could continue domestic consumption to build inventories over the next two years and shift the reduced consumption to an increase in U.S. imports. This would limit the impact of trade diversion, damage to domestic production, and may also bring China closer to the Phase One targets.
Both the United States and China can claim to have won this battle
Even if they are not achieved in full, progress toward them will likely be a modest plus for the U.S. economy. Faster growth is likely to result from the reduction in uncertainty, capacity take up in the targeted sectors (until constraints become binding), and increased exports. If the deal’s targets are maintained and enforced, it could also encourage additional investment in these sectors.
For an economy the size of the U.S., the $200 billion in additional purchases represents slightly under 1% of GDP (Chart 4). Spread over two years and subtracting inflation this represents a potential increase in annual economic growth of roughly 0.4%. In all likelihood, however, the growth impact will be significantly lower. For one, capacity constraints will likely begin to bind before they are hit. For two, upward pressure on the U.S. dollar would likely work in the opposite direction of the increased purchases in reducing the trade deficit with China. This is especially true given lingering uncertainty around thorny topics not covered in the Phase One deal such as industrial subsidies and Chinese State-Owned Enterprises (SOEs). These issues will keep the threat of future tariffs on the table and put downward pressure on the Chinese renminbi. Finally, trade diverted from other countries will slow economic growth in the rest of the world, thereby reducing demand for U.S. exports and offsetting some of the benefits of increased purchases from China.
The Phase One deal will also likely improve the near-term outlook for China. Most importantly, the deal means China avoids additional tariffs on its exports and the benefit of the rollback in existing tariffs. At the same time, the reduction in Chinese counter tariffs on U.S. imports should also benefit China’s economy, especially as it tries to reorient itself toward consumer-led domestic demand. On that front, China should benefit from the same improved business and consumer sentiment that will help lift U.S. growth. Easing monetary policy will also compliment this improved near-term outlook.
Over the longer term, the move away from market-based mechanisms and toward purchase quotes is unlikely to be positive for either economy. For the U.S., success on the deal increases its dependence on China, which, having shown its ability to direct purchases, could use the threat of a pullback as leverage in future negotiations. For China, the threat of tariffs has not been fully removed, while meeting its purchase commitments will disrupt well-established and relatively market-efficient supply chains, which is likely to put it in conflict with other trading partners. For both parties, the bilateral dispute resolution process creates the real risk that this is only a temporary pause in a longer trade war.
In the zero-sum world of managed trade, other countries may become victims
While the U.S. and China can claim to come out ahead, other countries are unlikely to be so lucky. China’s commitments to purchase U.S. goods and services will have a beggar-thy-neighbor effect. The deal will create inefficiencies from trade diversion and disadvantage other countries. In order to get a sense of how much trade could be diverted, we need a starting point measure of China’s “business as usual” import demand.
One simple assumption is that China’s imports within these categories grow at the same speed as its nominal GDP.4 Looking at the growth in manufacturing, agriculture and energy imports over the past decade, there is a solid correlation with nominal GDP growth (Chart 5).5 Given real growth of around 6% (slower this year due to the COVID-19) and inflation slightly over 2%, this implies import growth of 8.3% annually. Of course, China could “artificially” raise import growth – albeit not sustainably – by increasing inventories or reducing domestic production, as discussed above.
With this assumption, alongside total Chinese imports within these categories, we can estimate the total level of imports by 2021 and what China’s commitments would imply for the potential increase in U.S. market share. As of 2017, the U.S. had the biggest share of Chinese imports within manufacturing at around 20% of the total. Hitting the commitments within the deal would take it over 30%.
For manufacturing, the U.S. market share in 2017 stood at 9-10% (depending on whether you use Chinese or American reported data). Meeting the targets would bring it to over 14% by 2021, taking roughly 5% from the rest of the world. In growth terms, this would imply a third of China’s import growth is met by America alone. For energy, the current share stands at a paltry 2%-3%, but the ambitious targets would take it all the way up to 15%, implying a marked change in the share at the expense of the rest of the world.
Finally, for agriculture, the targets would bring America’s share up from around 20% to above 30%. In growth terms this would imply that the U.S. makes up 90% of the growth in Chinese agricultural imports. Overall, within all goods categories, purchases from the U.S. would have to make up roughly one half of the growth in Chinese imports.
Some of the largest economies in the world would be affected by the trade diversion caused by the Phase One deal (Chart 6). While there may be some scraps in terms of growth left in manufacturing and energy, relative to baseline, the decline in market share would put downward pressure on growth in these economies, some of which are already going through idiosyncratic slowdowns. If trade diversion takes place equally across all sectors covered in the deal, the manufacturing sector will be hit hardest, given it is the biggest sector in terms of absolute size, thereby further slowing down the already weak sector.
More specifically, within manufacturing, increased U.S. exports of motor vehicles to China – more than one fourth of China’s imports in the sector in 2017 – may come at the expense of the car manufacturers in the EU, Korea, and Japan. In the agricultural sector, expanding U.S. soybean exports – almost 40% of China’s total agricultural imports in the sector in 2017 – could divert trade from Brazil and Argentina. In the energy sector, higher imports from the U.S. in refined energy products (roughly 15 percent of Chinese imports in the sector in 2017) could come at the expense of countries such as UAE and Singapore.6 As noted above, countries affected by trade diversion will likely experience a growth slowdown, which would negatively impact their demand for U.S. goods and services.
There are also strong geopolitical implications in diverting trade for both the U.S. and China, as some of their strategic partners would be directly affected. Countries negatively impacted by the Phase One deal can seek recourse at the WTO based on the principle of non-discrimination in trade. However, the WTO’s ability to resolve disputes, and therefore the multilateral trading system, is in jeopardy after the U.S. vetoed new appointments to the appellate body.
Bottom Line: The Phase One deal forever changes the way we look at trade
The Phase One deal reduces short-term policy uncertainty, but it is unlikely to fully meet its overly ambitious goals. Managed trade would create trade diversion and inefficiencies in the global trading system and adversely impact other countries.
The Phase One deal suggests that higher tariffs are the new normal and marks a new way to analyze international trade. In fact, tariffs between the two countries remain higher than ever when compared to pre-trade-war years. Financial markets have reacted positively to the deal, suggesting that they have already priced in the permanency of higher tariffs. High frequency indicators related to manufacturing, trade, and business sentiment seem to have bottomed out recently, partly due to the Phase One deal (Chart 7). In short, the world has come to accept the new normal of tariffed and managed trade.
At the same time, Phase One avoids tackling the more contentious topics such as market distorting practices of Chinese SOEs and industrial subsidies. These topics are to be addressed by both countries – with two sharply contrasting economic and political systems – during the even more ambitious Phase Two. But, Phase Two is unlikely to make substantive progress this year due to U.S. elections and the diverted focus of the Chinese authorities towards containing COVID-19.
Moreover, since developments made by the Phase One deal are not enough to reduce the fundamental differences between the two countries, uncertainties will remain. Until the two countries address their fundamental issues, they will remain mired in the Thucydides’s Trap – a conflict between an existing hegemonic power challenged by an upcoming power. Trade is a symptom of that deeper conflict, which extends to differences over technology, capital flows, and geopolitics.
End Notes
- The list of covered products can be found in Annex 6.1 of “Economic and Trade Agreement Between the United States of America and The People’s Republic of China: Phase One”. https://ustr.gov/sites/default/files/files/agreements/phase%20one%20agreement/Economic_And_Trade_Agreement_Between_The_United_States_And_China_Text.pdf
- For example, the agreement creates legally enforceable obligations on currency policy, subjecting the two countries to a (weakly defined) dispute settlement process. Bilateral dispute settlement for currency policy could further politicize exchange rate assessments and weaken the agreement.
- Bilateral trade data for the U.S. and China are inconsistent with each other. For example, U.S. reported exports to China in 2017 in covered manufacturing goods are $50 billion, whereas Chinese reported imports from the US for the same goods are $78 billion. And since the agreement allows for possible use of either country’s reported trade statistics, confusion regarding the targets is inevitable. However, the discrepancies are not unique to the US and China. Trading partners often have discrepancies in the data that they report.
- While they tend move together, import growth has on average underperformed nominal GDP growth over the past decade, as China moves towards more domestic production to meet its own consumption. A generous baseline assumption, then, would be that overall Chinese imports maintain the current share of overall GDP and grow at roughly the same rate.
- The services sector is not included in Chart 5 since Chinese data on services imports is not detailed enough for the covered services subsectors described in the agreement.
- Trade diversion is unlikely for some of China’s largest crude oil exporters such as Russia and Saudi Arabia. This is because much of what China requires is medium and heavy grade oil, which is already being provided by Russia and Saudi Arabia, whereas U.S. exports are predominantly in light crude. It would also be difficult to divert trade from current LNG exporters such as Australia and Qatar due to the long-term nature of LNG contracts (average LNG contract length was 13 years in 2018).
 Signal2forex.com - Best Forex robots and signals


