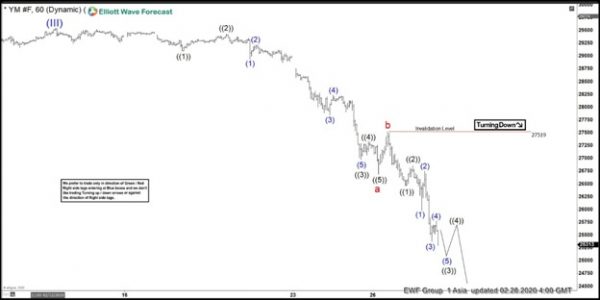
Short term Elliott Wave view in Dow Futures (YM_F) suggests the Index ended the cycle up from October 3, 2011 low in wave (III) at 29543 high. The index is correcting that cycle in wave (IV) as a zig-zag. Wave a of (IV) ended at 26692 low. The internal subdivision of wave a unfolded as a 5 waves impulse Elliott Wave structure. Wave ((1)) of a ended at 29100 and the bounce in wave ((2)) ended at 29434. The index then extended lower in wave ((3)), which ended at 26976 low and followed by a bounce in wave ((4)), which ended at 27333 high. The index then pushed lower in wave ((5)) and ended at 26692 low. From there, the index bounced in wave b and ended at 27519 high.
Down from wave b high, the index resumed lower in wave c, which is still in progress. Wave ((1)) of c ended at 26468 low. It then bounced in wave ((2)) and ended at 26859 high. From there, the index extended lower in wave ((3)), which subdivides in lesser degree 5 waves. Wave (1) of ((3)) ended at 25979 low and the bounce in wave (2) ended at 26754 high. Down from there, wave (3) resumed lower and ended at 25379 low. Wave (4) bounce then ended at 25772 high. Currently, wave (5) of ((3)) remains in progress and will be followed by a bounce in wave ((4)) when completed later. While below 27519 high, the bounce in 3,7, or 11 swings is expected to fail. The index can see more downside to complete wave (IV) correction before upside resumes. Potential area where wave c can end is 100% – 161.8% Fibonacci extension of wave a-b which comes at 23349-24943 area.
INDU (YM_F) 1 Hour Elliott Wave Chart
 Signal2forex.com - Best Forex robots and signals


