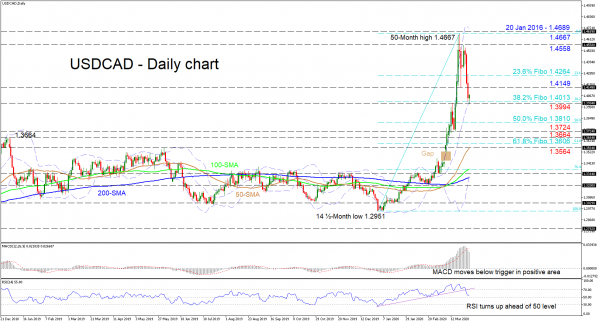
USDCAD is currently finding some footing at the mid-Bollinger band, which is encapsulated between the 1.4013 level – that being the 38.2% Fibonacci retracement of the up leg from 1.2951 to 1.4667 – and the inside swing high of 1.3994, after pivoting from a multi-year high of 1.4667.
Despite the short-term oscillators displaying a negative mode for now, the negative momentum backing the retracement in the price seems to have weakened, with the RSI stalling above its neutral mark and the MACD, deep in the positive region, easing its drop below its red trigger line. That said a significant move would be needed to shift the positive signals reflected in the upward sloping simple moving averages (SMAs).
If buying interest picks up, initial resistance could come from the inside swing low of 1.4149 before the 23.6% Fibo of 1.4264. Sustaining the climb could see the 1.4558 swing high being tested, prior to the multi-year peak of 1.4667 and the resistance of 1.4689 overhead, challenging buyers’ efforts for further advances.
If the 2 ½-month rally’s retracement manages to dive below the tough 1.4013 – 1.3994 key support area, the price may plunge towards the 50.0% Fibo of 1.3810 ahead of a more important trough of 1.3724. Dropping below this too, the inside swing high of 1.3664 from December 31 could prevent the price from testing the 61.8% Fibo of 1.3606 and the 50-day SMA located at the 1.3564 obstacle.
Overall, the short-term bias is cautiously positive above 1.3994. However, the near-term picture’s bearish bearing could shift the short-term bias to a bearish one with a break below 1.3724.
 Signal2forex.com - Best Forex robots and signals


