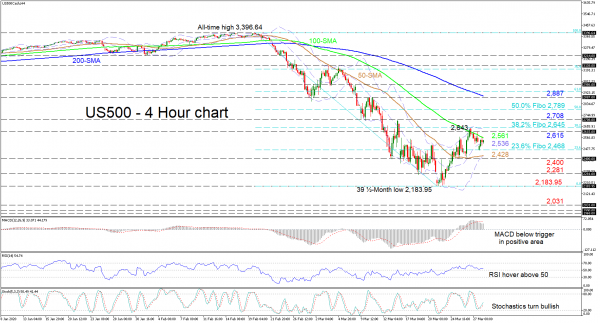
US 500 index (Cash) seems to have lost steam in its pullback from the multi-year low of 2,183.95 dropping the price back to its mid-Bollinger band around the 100-period simple moving average (SMA) at 2,561.
The stall in positive momentum is also reflected in the short-term oscillators. The MACD, in the positive region, has dropped below its red trigger line, while the RSI, declined to hover above its neutral mark. On top of this, the downward sloping 100- and 200-period SMAs continue to aid a bearish picture. That said the bullish stochastics, with room to improve and the flattened 50-period SMA are attempting to breathe fresh confidence into a positive move.
Should the index steer below the mid-Bollinger band around 2,536, initial support could come from the 2,468 level, which is the 23.6% Fibonacci retracement of the down leg from 3,396.64 to 2,183.95. Moving lower, the 50-period SMA at 2,428 coupled with the lower Bollinger band and the 2,400 barrier beneath, could prevent the price from falling towards the 2,281 support. Breaching this too, the pair may return to the 39 ½-month low of 2,183.95 before the November 2016 level of 2,031 draws focus.
Otherwise, pushing above the capping 100-period SMA at 2,561, an immediate resistance region from the 2,615 high to the 38.2% Fibo of 2,645 – which also encompasses the upper Bollinger band – could impede the index from appreciating towards the 2,708 border. Overtaking this, the price may challenge the 50.0% Fibo of 2,789 ahead of the 2,887 obstacle, where the 200-period SMA also resides.
Overall, a negative bias in the near-term continues to exist below the 2,708 level and more importantly below 2,887.
 Signal2forex.com - Best Forex robots and signals


