Executive Summary: A Group of Black Swans Create Their Own Path
While we are just beginning to see the economic impacts of COVID-19 appear in the data, it is clear that what we will see in the coming months will be truly unprecedented. Few analysts were forecasting a recession coming into the year and even fewer anticipated that we would combat a pandemic in 2020. In many respects, this highly improbable but impactful event meets the criteria of a Black Swan.1 While we are likely to see large swings in a number of indicators over the coming months, only some may return to their pre-crisis trend. In this report, we raise the question of whether the COVID-19 is a black swan or a group of black swans. While one can look at COVID-19 as a singular economic shock, its longer-term implications for different sectors of the economy may vary.
We illustrate these heterogeneous effects by looking back to the Great Recession, when the economy faced another high-impact, low-probability shock. Virtually all sectors saw historically significant swings in 2008 and 2009, but only some returned to their pre-crisis trend in the post- Great Recession era. It is too soon to know what long lasting impacts COVID-19 will have on macroeconomic statistics, but for those attempting to model the economy, it is vital to anticipate these potential trend changes.
A Black Swan vs. A Group of Black Swans: Which is Worse?
Both a black swan and a group of black swans are highly improbable events with a significant impact on the economy, but they differ in their aftermath. The difference between these two terms has significant implications for decision making as well as for modeling and forecasting.2 As we watch the unprecedented economic impacts of the COVID-19 pandemic, it is important to distinguish the overarching event from its potentially heterogeneous effects on various parts of the economy. Looking back to the Great Recession can provide useful insights into how a large shock can have varying effects on different sectors of the economy.
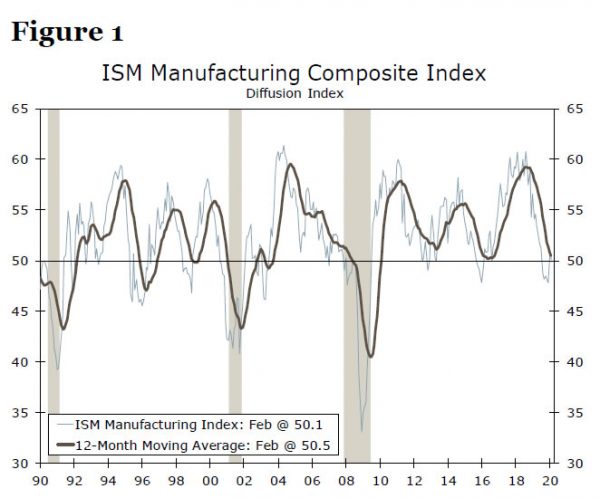
The ISM manufacturing index experienced a sharp decline in the Great Recession, falling 34% from its pre-recession peak in November 2007 to its trough in December 2008. The index bounced back relatively quickly, however, and crossed back into expansion eight months later (Figure 1). Industrial production (IP) also dropped considerably during the crisis. While it did not recover as quickly as the ISM index, it did return to its pre-crisis trend. This was not true for all variables, however.
The extraordinary path of monetary policy during the crisis and the subsequent recovery left the Fed funds rate (FFR) far below its pre-recession peak throughout the post Great Recession era (Figure 2). Moreover, failing to regain the previous peak wasn’t the only ‘unusual path’ taken by the FFR. The overall behavior of the FFR was different than the past recessions and recoveries. The FFR was on pause from December 2008 to December 2015—the longest duration of no-change in the FFR as far back as data are available (effective fed funds goes back to the 1950s). When the FOMC eventually began to raise rates, it was the slowest pace of rate hikes in decades. The FOMC also engaged in several rounds of quantitative easing, which took the Fed’s balance sheet to over $4 trillion. The unprecedented measures taken by the FOMC were necessary to stimulate the fledgling recovery, but they undoubtedly changed how we interpret changes in the FFR in our economic and financial models.
Of course, monetary policy was not the only area that the Great Recession affected in this manner. The unemployment rate (a proxy for the labor market) and housing starts (a proxy for the housing sector) also fell into the group of black swans in the Great Recession. The length of time for the peak unemployment rate to recover to its previous trough was 60 months after the 1991 recession and 43 months following the 2001 recession, but a whopping 91 months after the Great Recession (Figure 3). Housing starts also exhibited different behavior after the Great Recession. In fact, housing starts have yet to reach their pre-recession levels in the post Great Recession era (Figure 4). Furthermore, housing starts stayed above one million units in the 1992-2007 period but dropped below this level from July 2008 until December 2012.
Expecting these areas would go ‘back-to-normal’ after the Great Recession could have led to misguided models and biased forecasts. IP and the ISM manufacturing index followed their prerecession pattern, but housing starts and many other indicators took a different path. The unemployment rate took longer than expected to get back to ‘normal.’ The biggest surprise was that monetary policy was in a completely different universe.
By the same token, whether COVID-19 is a black swan or a group of black swans for some sectors is unknown. How long will it take to contain COVID-19? What will be the ultimate depth or duration of the damages to the economy? Obviously, these are extremely difficult to predict and that is why COVID-19 may be classified in family of black swans. However, based on our experience from the Great Recession, one cannot assume everything will go back to normal. A better approach is to monitor the upcoming data to gauge which sector shows signs of a black swan (going back to the pre-shock trend/behavior) and what sectors exhibit characteristics of a group of black swans.
Forecasting Implications of a Group of Black Swans: Don’t Live in the Past
Our past work highlights our modeling and forecasting experience after the Great Recession.3 For some models such as IP and the ISM index, we re-calibrated parameters to incorporate the Great Recession break but most of the inputs were the same, as these sectors followed the similar trends/behavior after the recession. Others models required new inputs (new predictors in addition to new parameters), such as nonfarm payrolls and housing starts in order to capture the new, postgreat recession patterns. Finally, some variable lost their predictive power. The constant Fed funds rate from December 2008 to December 2015 provided little predictive insights for other areas of the economy that continued to fluctuate.
Thus, we strongly suggest that analysts who are interested in modeling and forecasting to go back to the drawing board after the COVID-19 outbreak and re-build models. We are planning to do the same.
Conclusion: COVID-19 May Alter Some Sectors’ Trend
Based on our experience after the Great Recession, we plan to carefully monitor the upcoming data to gauge signs of changes in the trends and behavior of underlying variables. Because COVID-19 has already disrupted the global economy and pushed policymakers to announce some of the largest stimulus packages that we have ever seen, we cannot be sure that everything will return to ‘normal.’
1 For more detail about black swan events see, Taleb, Nassim. (2008). The Black Swan: The Impact of the Highly Improbable. Penguin 2008
2 In statistical terms, a black swan is an extreme event (or a shock) with a significant impact, but the distribution of the variable remains the same. On the other hand, a group of black swans is also an extreme event (or a shock), but it changes the distribution of the variable. In simpler terms, a black swan causes a temporary disruption and a group of black swans pose a long lasting disruption. For more detail, please see chapter 13 of the book by Silvia, J. Iqbal, A. Bullard, S. Watt, S. and Swankoski, K. (2014). Economic and Business Forecasting: Analyzing and Interpreting Econometric Results. Wiley 2014
3 John Silvia and Azhar Iqbal. (2012). A Comparison of Consensus and BVAR Macroeconomic Forecasts. Business Economics, Vol 47, No 4.
 Signal2forex.com - Best Forex robots and signals


