GBPJPY pulled back off the descending trend line which has been holding over the last six weeks despite the upside break at the end of April, diving beneath the 132.00 psychological mark.
According to the RSI, the market could maintain positive momentum in the short-term as the indicator is positively sloped above its neutral threshold of 50, the fast Stochastics suggest that some weakness is possible while the MACD is also flattening in the bullish region.
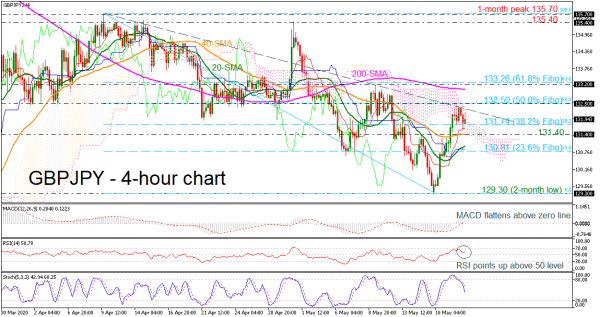
Heading southwards, the price could attempt to slip below the 38.2% Fibonacci retracement level of the down leg from 135.70 to 129.30 at 131.74 and the Ichimoku cloud and retest the 131.40 support, which lies near the 40-period simple moving average (SMA) in the 4-hour chart. Should traders continue to sell the pair below that barrier, support would then run towards the 130.81 level, being the 23.6% Fibo, but first the price needs to bear the 20-period SMA at 130.98.
In the positive scenario, where the price continues to expand above the falling trend line, a top could be formed around the 50.0% Fibo at 132.50, which overlaps with the latest peak. If the market manages to overcome that area, traders could look for resistance at the 200-period SMA at 133.00, near the upper surface of the Ichimoku cloud, and then could move towards the 133.20 – 133.26 area, which includes the 61.8% Fibonacci.
Overall, if there is a successful jump above the 61.8% Fibo, the bias could turn to neutral. Otherwise, a continuation of the current trend would resume the downside structure in the short-term and medium-term timeframes.
 Signal2forex.com - Best Forex robots and signals


