NZDUSD’s positive picture appears to withstand negative pressures, glued just under the 50- and 100-period simple moving averages (SMAs) and holding just inside the Ichimoku cloud. The pair has adopted a horizontal tone over the last weeks, something also mirrored in the unclear Ichimoku lines and the mostly horizontal state of the Ichimoku cloud.
Presently above the 0.6380 level, the predominant bearing is positive, something also reflected within the 100- and 200-period SMAs in spite of the failing and lagging 50-day SMA. That said, the very short-term picture is leaning towards the downside due to the price’s current direction and the negative signals in the oscillators. The MACD and the RSI are marginally dipping lower at their neutral marks, suggesting weakening momentum. Moreover, in the stochastic oscillator, the %K line has reached the overbought 80 mark, which warrants a push lower in the price.
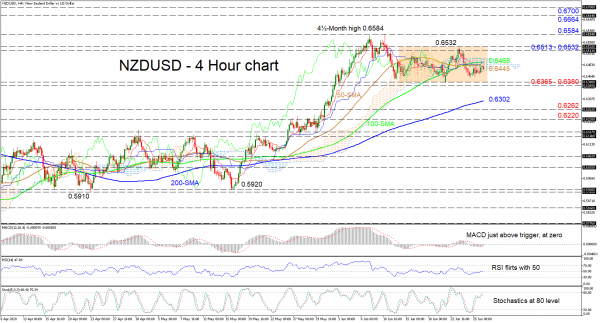
Should sellers push under the lower surface of the cloud and the red Tenkan-sen line, early tough support could arise from the area between the 0.6380 floor of the sideways market and the 0.6365 trough just beneath. If this border fails to halt declines, the 200-period SMA at 0.6302 could come into focus. If this disappoints as well, the 0.6262 and 0.6220 lows around the start of June could then be challenged.
To the upside, initial resistance may occur from the 50- and 100-period SMAs at 0.6445 and 0.6468 respectively, ahead of the top of the cloud. If buying interest persists, the resistance section from the high of 0.6513 until the ceiling of the range at 0.6532 could prevent the pair from seeing the four-and-a-half-month peak of 0.6584. More gains may lead to the 0.6664 and 0.6700 obstacles achieved back in January.
In brief, the very short-term bias is neutral and ultimately a break either above 0.6532 or below 0.6380 would suffice in revealing the next price course.
 Signal2forex.com - Best Forex robots and signals


