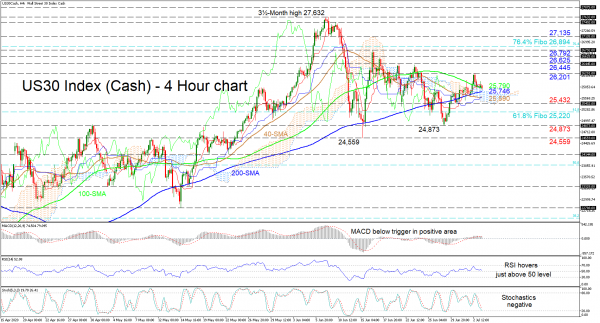
US 30 stock index (Cash) is resting on the 100-period simple moving average (SMA) at 25,790, merged with the upper surface of the Ichimoku cloud and finding further support from the positively charged 200-period SMA just beneath, at 25,746. At the glance it seems this mostly neutral picture that has taken over the last weeks may be here to stay for a while.
Conflicting signals exist in the directional picture of the index. The bullish Ichimoku lines mirror growing positive momentum, while the 50- and 100-period SMAs promote weakening in the price. At the moment, the short-term oscillators seem skewed towards a negative outcome. The MACD, in the positive region, has dipped below its red signal line, while the RSI – currently just above 50 – is starting to head south. Moreover, the %K line has just slipped below the 20 mark, suggesting downside moves.
If buyers re-emerge, initial defence to the upside may arise from the 26,201 obstacle. Should buyers run higher, the 26,445 and 26,625 highs could attract attention ahead of the peak of 26,792 achieved on June 16. Overcoming this barrier, the 26,894 level, which is the 76.4% Fibonacci retracement of the down leg from the all-time high of 29,582.61 to 18,170, could prevent the index meeting the 27,135 resistance.
Alternatively, diving under the 100- and 200-period SMAs into the cloud, the index may face some friction from the 50-period SMA at 25,590 ahead of the 25,432 low. A step under may encounter the 61.8% Fibo of 25,220 ahead of the 24,873 border of June 29. Further loss of ground could sink towards the 24,559 key trough.
In brief, the very short-term picture maintains a neutral-to-bullish bias and a break above 26,792 could revive the bigger bullish picture.
 Signal2forex.com - Best Forex robots and signals


