Key Highlights
- Gold price is recovering higher, but it is facing a strong resistance near $1,910.
- A significant bearish trend line is forming with resistance near $1,915 on the 4-hours chart of XAU/USD.
- EUR/USD recovered above 1.1700, but GBP/USD failed to hold gains above 1.3000.
- The US Initial Jobless Claims in the week ending Oct 31, 2020 could decline from 751K to 733K.
Gold Price Technical Analysis
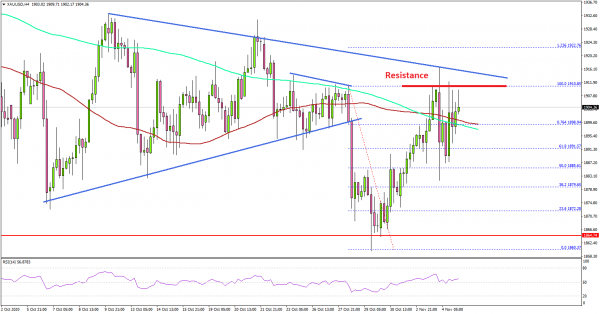
After a steady decline, gold price found support near $1,860 against the US Dollar. A fresh increase was initiated and the price was able to recover above the $1,880 and $1,888 resistance levels.

The 4-hours chart of XAU/USD indicates that the price followed a decent bullish path from the $1,860 swing low and settled above the $1,880 resistance. There was also a break above the 76.4% Fib retracement level of the downward move from the $1,910 swing high to $1,860 swing low.
The price is now trading above $1,900, the 200 simple moving average (green, 4-hours), and the 100 simple moving average (red, 4-hours).
However, there is a strong resistance forming near $1,910 and $1,915. There is also a significant bearish trend line forming with resistance near $1,915 on the same chart. Therefore, a clear break above the $1,910 and $1,915 resistance levels could clear the path for more gains.
Conversely, the price might fail to continue higher above $1,915 and it could start a fresh decline. An initial support is near the $1,900 zone and the 100 SMA. A close below $1,900 and $1,895 might open the doors for a push towards the $1,880 support.
Overall, gold price is reaching a major breakout and it seems like US election results could impact in the near term. Looking at EUR/USD, the pair recovered above the 1.1700, but it is struggling to gain momentum. Conversely, GBP/USD failed to stay above 1.3000 and it is currently following a bearish path.
Economic Releases to Watch Today
- BoE Interest Rate Decision – Forecast 0.1%, versus 0.1% previous.
- US Initial Jobless Claims – Forecast 733K, versus 751K previous.


 Signal2forex.com - Best Forex robots and signals


