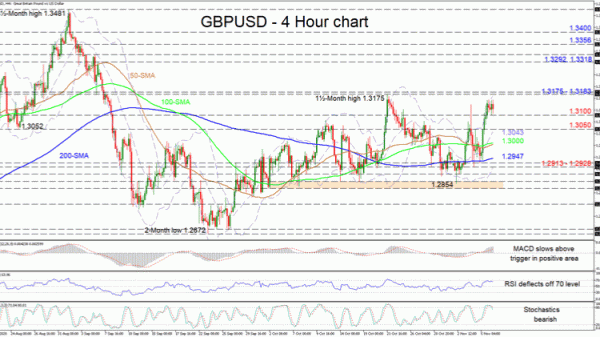
GBPUSD is consolidating beneath the 1.3175-1.3183 limiting border after surging off the 200-period simple moving average (SMA) and above the 50- and 100-period averages. The fairly horizontal bearing of the SMAs are promoting the neutral picture. That said, the price is currently near the upper Bollinger band and is showing some signs of weakness.
The short-term oscillators reflect the stall in positive price action. The MACD is in the positive region and above its red trigger line but looks to be easing. Endorsing a pullback in the pair is the dipping RSI that has deflected off the 70 mark and the stochastics oscillator, which has adopted a bearish tone.
Receding from the upper Bollinger band, initial support may occur at the 1.3100 handle. Slipping past this, the 1.3050 inside swing high and mid-Bollinger band beneath at 1.3043, may try to impede the pair from reaching the 100- and 50-period SMAs standing around the 1.3000 level. Should sellers persist, the 200-period SMA at 1.2947 and the support section of 1.2913-1.2928, where the lower Bollinger band also is located, may attempt to dismiss the decline.
In a positive scenario, immediate resistance may develop from the upper Bollinger band and the overhead region of 1.3175-1.3183. Conquering these highs may drive the pair upwards to the 1.3292 and 1.3318 peaks around the beginning of September. Further gains may then steer the pair to challenge the 1.3356 barrier and 1.3400 hurdle.
Concluding, GBPUSD maintains a neutral bias in the short-term timeframe, currently restrained within the 1.2836 and 1.3183 constraints.


 Signal2forex.com - Best Forex robots and signals


