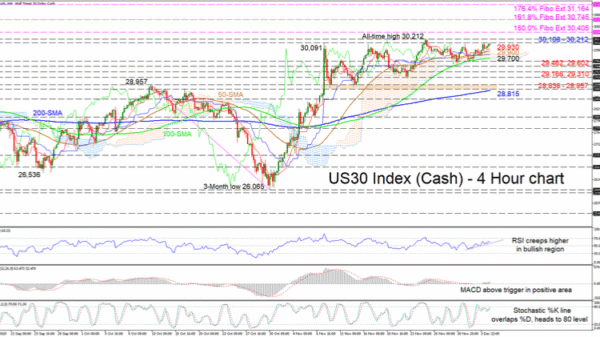
The US 30 stock index (Cash) is tiptoeing higher after finding traction off the 100-period simple moving average (SMA), attached to the lower surface of the Ichimoku cloud. Although the Ichimoku lines are fairly directionless, the red Tenkan-sen line is nudging the price marginally higher. The indices’ positive structure appears safeguarded above the support zone of 28,838-28,957 and is being defended by the improving trajectory of the SMAs.
The short-term oscillators are echoing intact positive momentum. The MACD, slightly above zero, is rising over its red trigger line, while the RSI is attempting to sustain its climb in the bullish region. Looking at the stochastic oscillator, the %K line is approaching the 80 mark, endorsing more advances.
To the upside, constraints may arise from the immediate resistance section of 30,108-30,212, which also involves the all-time high of 30,212. If buyers set their compass for uncharted territories, resistance could next come at the 30,405 level, which happens to be the 150.0% Fibo extension of the down leg from 28,957 until 26,065. Should their sails gain wind, the price may navigate towards the 161.8% Fibo of 30,745 before jumping higher towards the 176.4% Fibo of 31,164.
Alternatively, steering below the red Tenkan-sen line at 29,930, sellers may face an early support zone from the 50-period SMA at 29,900 until the 100-period SMA ay 29,700. Decisively diving underneath this region, which is surrounding the cloud and blue Kijun-sen line, the price may meet the 29,602 and 29,462 neighbouring lows, respectively, before declining to challenge the 29,310 and 29,166 key troughs.
All in all, the US30 index appears to be aiming for uncharted waters as it is maintaining its neutral-to-bullish tone above the SMAs, the cloud, and the 29,462 mark.


 Signal2forex.com - Best Forex robots and signals


