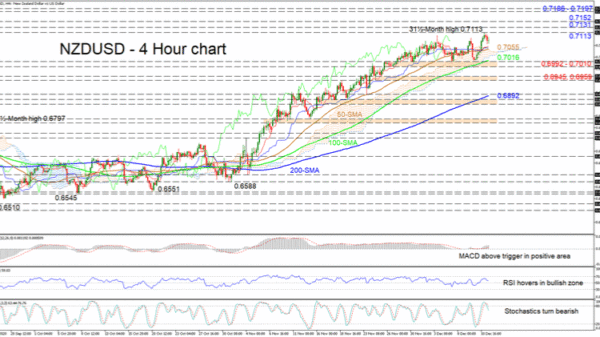
NZDUSD is retreating from its freshly plotted 31½-month high of 0.7113 in the four-hour chart, as positive drive seems to have taken the back seat, something also reflected in the directionless Ichimoku lines. That said the solid bullish bearing of the simple moving averages (SMAs) is protecting the uptrend.
The short-term oscillators are communicating conflicting signals in directional momentum. The MACD, above zero and its red trigger line, is conveying improvements in price, while the recently turned bearish stochastic oscillator, is promoting a deeper pullback in the pair. Looking at the RSI, which is somewhat hovering in bullish territory, the scale tilts slightly to the positive side.
To the downside, support may originate from the Ichimoku lines and the 50-period SMA, residing around 0.7055, ahead of the Ichimoku cloud, which is floating beneath. If the pair retraces underneath the cloud, downside limitations may next arise from the 100-period SMA at 0.7016 and the key adjacent support section of 0.6992-0.7010. Steeper declines may then target the 0.6959 and 0.6945 troughs around the end of November.
Alternatively, reviving buying interest may see the pair revisit the multi-year top of 0.7113. Overcoming this first resistance border, the pair may jump towards the 0.7131 high of April 2018 before stretching towards the 0.7152 barrier. Should further gains unfold, the price may step up to challenge the region of inside swing lows of 0.7186-0.7197, identified from the end of March to the end of April of 2018.
Summarizing, the short-term bullish structure remains firm should NZDUSD manage to keep above the 0.6992-0.7010 support base, thus increasing the possibility for further positive developments in the pair.


 Signal2forex.com - Best Forex robots and signals


