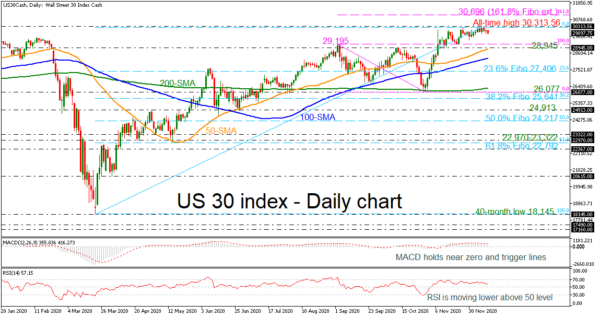
The US 30 stock index (Cash) is edging south from its freshly logged all-time-high of 30,313.56. Positive sentiment seems to be taking a breather as the momentum indicators are losing some momentum. The MACD, in the positive region, is holding below its trigger line, while the RSI is exhibiting a stalled positive picture. However, the bullish 50- and 100-day simple moving averages (SMAs) could boost the price, sending the index to uncharted peaks.
In a bullish scenario, immediate resistance may develop from the record high at 30,313.56. Should the index thrust above this new ceiling, the price may propel towards the 30,500 number ahead of the 30,696 level, which happens to be the 161.8% Fibonacci extension of the down leg from 29,195 to 26,077. Even higher, the price may target the 176.4% Fibo extension of 31,125.
In case of more losses, support could come from the 28,945 barrier, which coincides with the 50-day SMA ahead of the 100-day SMA at 28,265. Failing to halt negative tendencies, the price may hit the 23.6% Fibonacci retracement level of the up leg from 18,145 to 30,313.56 at 27,406. Dropping further, the 200-day SMA and the 26,077 level could attract attention.
Concluding, the US 30 index is in a strongly bullish picture in the long term, despite the latest downside pullback over the last couple of days.
 Signal2forex.com - Best Forex robots and signals


