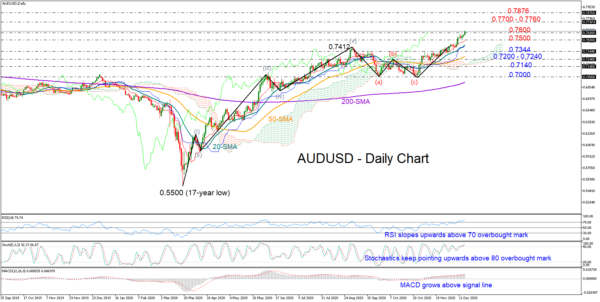
AUDUSD’s impressive rally shows no signs of abating as the pair is set to explore the 0.7600 zone for the first time in 2 ½ years.
The pair seems to have completed a three-step corrective cycle (a-c) and is currently building a new bullish wave, with the technical indicators endorsing the positive mode in the market.
Although well into the overbought territory, the RSI and the Stochastics have yet to find a turning point, reflecting a cautiously bullish short-term bias. The MACD continues to stretch upwards and above its red signal line, while the supportive red Tenkan-sen line keeps trending up alongside the 20-day simple moving average (SMA).
Should the bulls successfully claim the 0.7600 level, a tougher barrier may emerge within the 0.7700 – 0.7760 area, which acted both as support and resistance during the 2015 – 2018 period. If that wall collapses, the next stop could be around the 0.7876 hurdle.
In the event of a downside reversal, the red Tenkan-sen line around 0.7500 could attract immediate attention as the indicator has been providing a strong footing since mid-November. Failure to hold above it could confirm additional losses towards the 20-day SMA and the 0.7344 restrictive region, while lower, the sell-off could stabilize somewhere between 0.7240 and 0.7200.
Meanwhile in the medium-term window, the golden cross between the 50 and 200-day SMAs is backing the strengthening bullish trajectory in the market.
Summarizing, AUDUSD continues to face upside risks in the short run. Still, a pullback would be normal in an uptrend, especially when the market is rising in overbought territory.
 Signal2forex.com - Best Forex robots and signals


